Introduction
In the past, maps were static and constrained in scope. Cartographers hand-drawn them on paper or parchment using tools like compasses and rulers to create detailed designs. As technology advanced, these maps were digitized into graphical formats and published on the websites. Today, interactive mapping technologies, such as Geographic Information Systems (GIS) and Mapping APIs, have transformed maps into dynamic tools and eliminated static limitations.
As reported on the Linearity website in 2023, “88% of marketers integrating interactive content into their strategies claim they gain better brand recognition and engagement”. In particular, this emphasizes the effectiveness of interactive elements on websites, such as maps, infographics, and data visualizations. Instead of passively receiving information, interactive maps simplify complex geographical data through color coding, animations, and customizations, enhancing user experience.
Interactive maps can enhance users' experience and interaction on websites. They allow users to manipulate and tailor the interface of several elements intuitively to update information quickly. Such features are helpful for non-profit organizations, businesses, and educational websites that need to showcase location-based relevant content.
While no solution exists for every interactive map project, the right tools and skills can enable users to quickly navigate and understand vital information, such as locations, trends, or real-time data. Hiring a professional website development company can speed up the integration process, ensuring the interactive map is incorporated properly, visually appealing, and optimized for usability. This can save time and avoid costly trial-and-error.
This article will cover everything about interactive maps, including their types, how to create one, best design practices, and practical examples to help you implement them effectively on your website or application.
Defining Interactive Maps
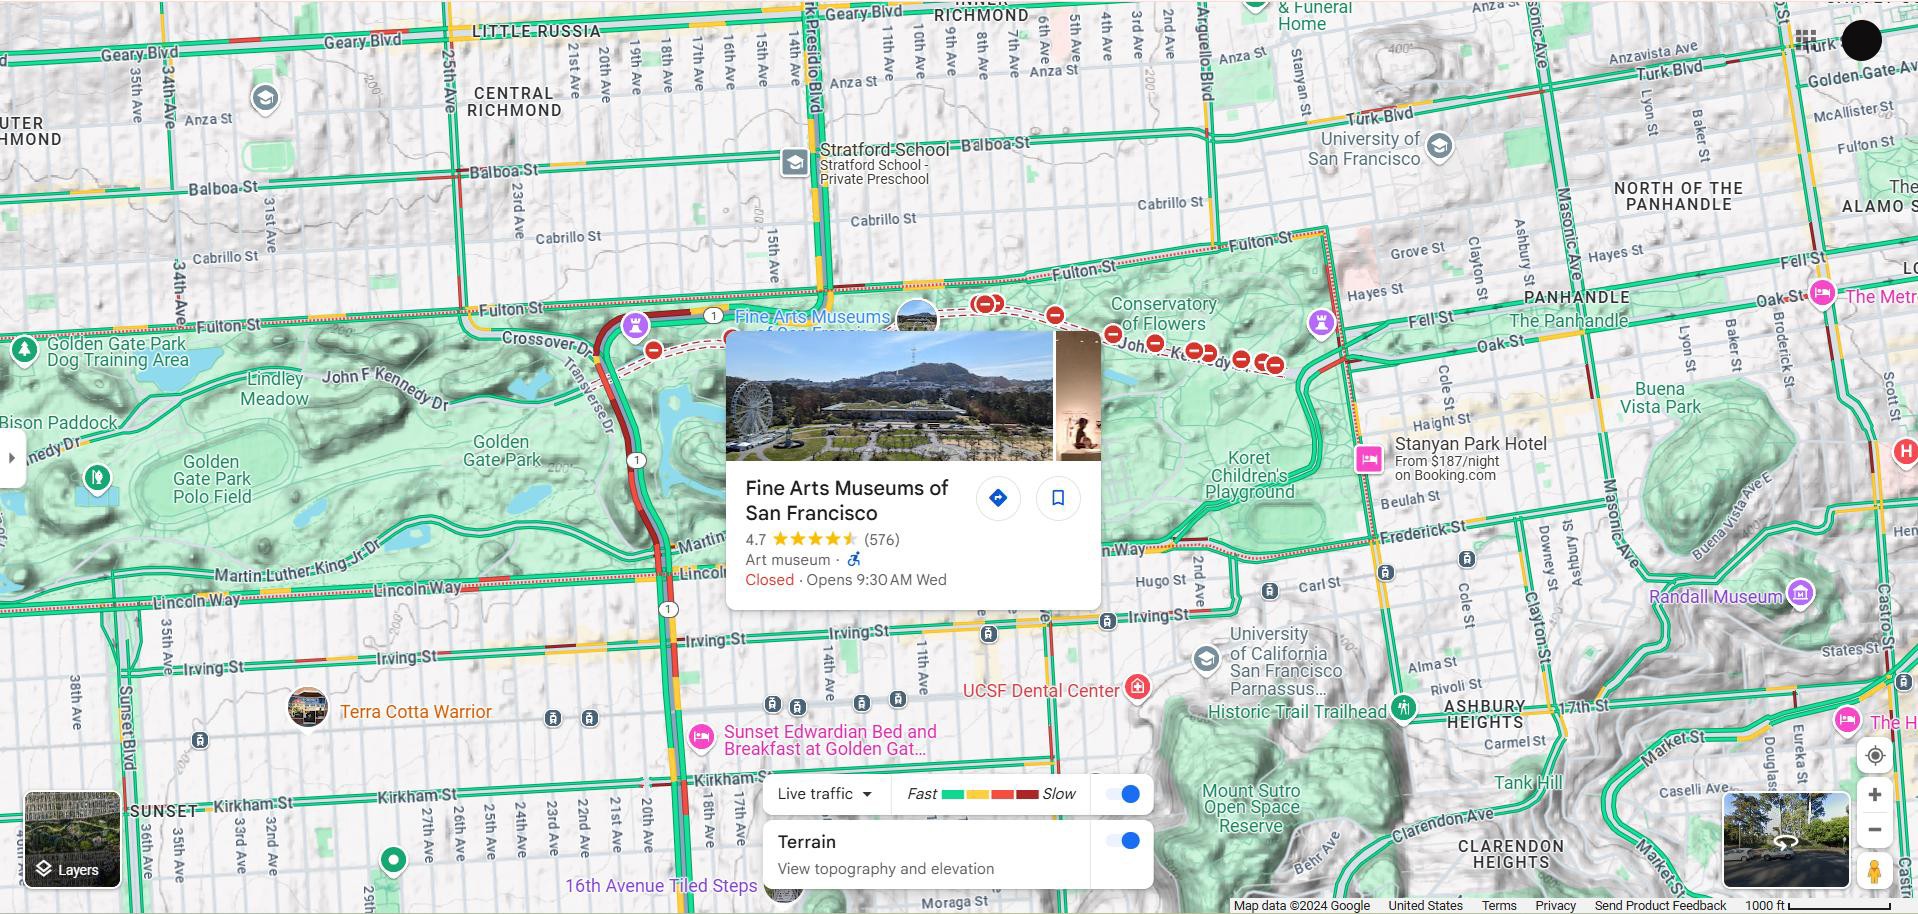
Interactive maps allow users to explore geographical information with customizable features such as location markers, dynamic navigation, and other filter options to create an engaging user experience. A screenshot from Google Maps
What is an interactive map?
An interactive map is a digital interface enabling users to interact actively with geographical information and customize content.
This includes standard features such as location markers, dynamic navigation, color customization, and pop-ups to create an engaging user experience.
Static Maps vs. Interactive Maps
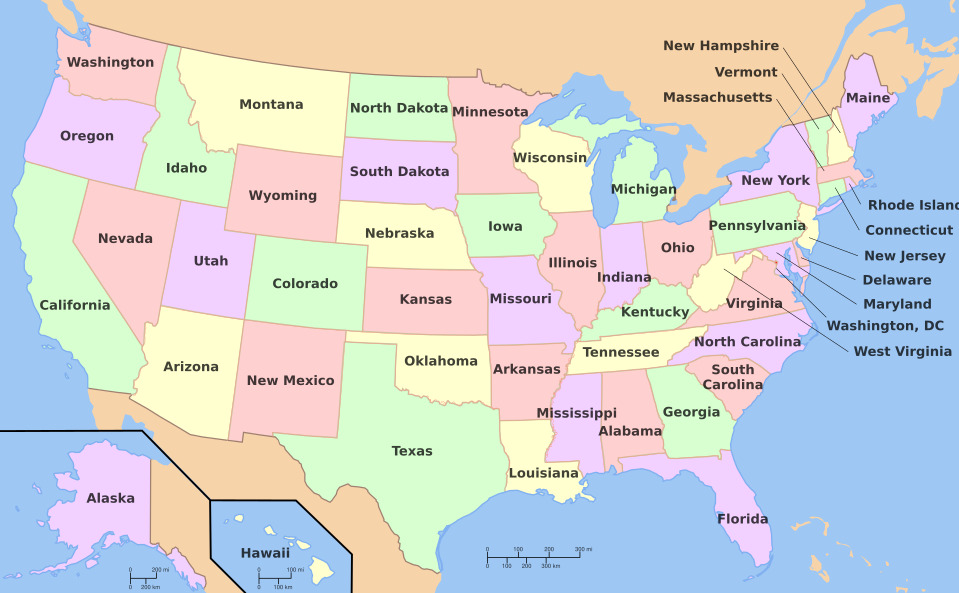
Static maps are standalone images, usually in JPEG or PNG format. These maps are designed for viewing purposes only and do not require any technology for interaction. (Image Source)
Static maps are fixed images (often in JPEG or PNG formats) uploaded on websites or mobile apps for viewing only. They are typically discrete images with no interactivity and do not require mapping technologies like libraries, APIs, or SDKs. Examples include traditional paper maps or those created with graphic design tools, digitized for use on computers and electronic devices.
While static maps present information without interaction, interactive maps let users zoom in, pan across data, click on locations, and customize the map's visuals to meet their needs. These maps require specific mapping tools and technologies, making them highly suitable for website location-based services. In addition, they offer visualization of the data about particular regions, making maps interactive and user-friendly.
Interactive maps are not limited to non-profit or educational websites only but also in advanced applications like geospatial services, urban planning, and environmental monitoring. As mapping software and technologies advance, new avenues arise to create an interactive platform with advanced features and analytical functions, which will benefit future society.
Common Technologies for Interactive Maps
Several tools and technologies are available to make interactive map features for your website.
Here are some of the key technologies you can use if you want to integrate an interactive map for your website or application:
1. GIS (Geographic Information Systems)
Esri is a leading company in Geographic Information Systems (GIS) software. It is best known for its primary product, ArcGIS. GIS systems analyze and display geographically referenced information through various visualization methods. (Image Source)
Geographic Information Systems (GIS) are software designed to integrate various data layers with spatially referenced locations on Earth. It can capture, store, manage, analyze, and present different types of geographical data. Some of its features include data point visualization, geocoding, pop-ups, zooming, and panning functionality, which are helpful for user interaction.
GIS interactive maps can be developed using ArcGIS, QGIS and similar GIS programs.
2. JavaScript Libraries
Mapbox is one of the popular JavaScript libraries for creating interactive maps. JavaScript libraries enable seamless integration of interactive maps and provide extensive customization options to enhance the user experience. (Image Source)
Javascript libraries are often included in creating interactive maps to customize map features. These libraries are highly efficient in improving opportunities for interaction.
Two widely used libraries that most developers use to make an interactive map are Leaflet and Mapbox.
3. Web Mapping APIs
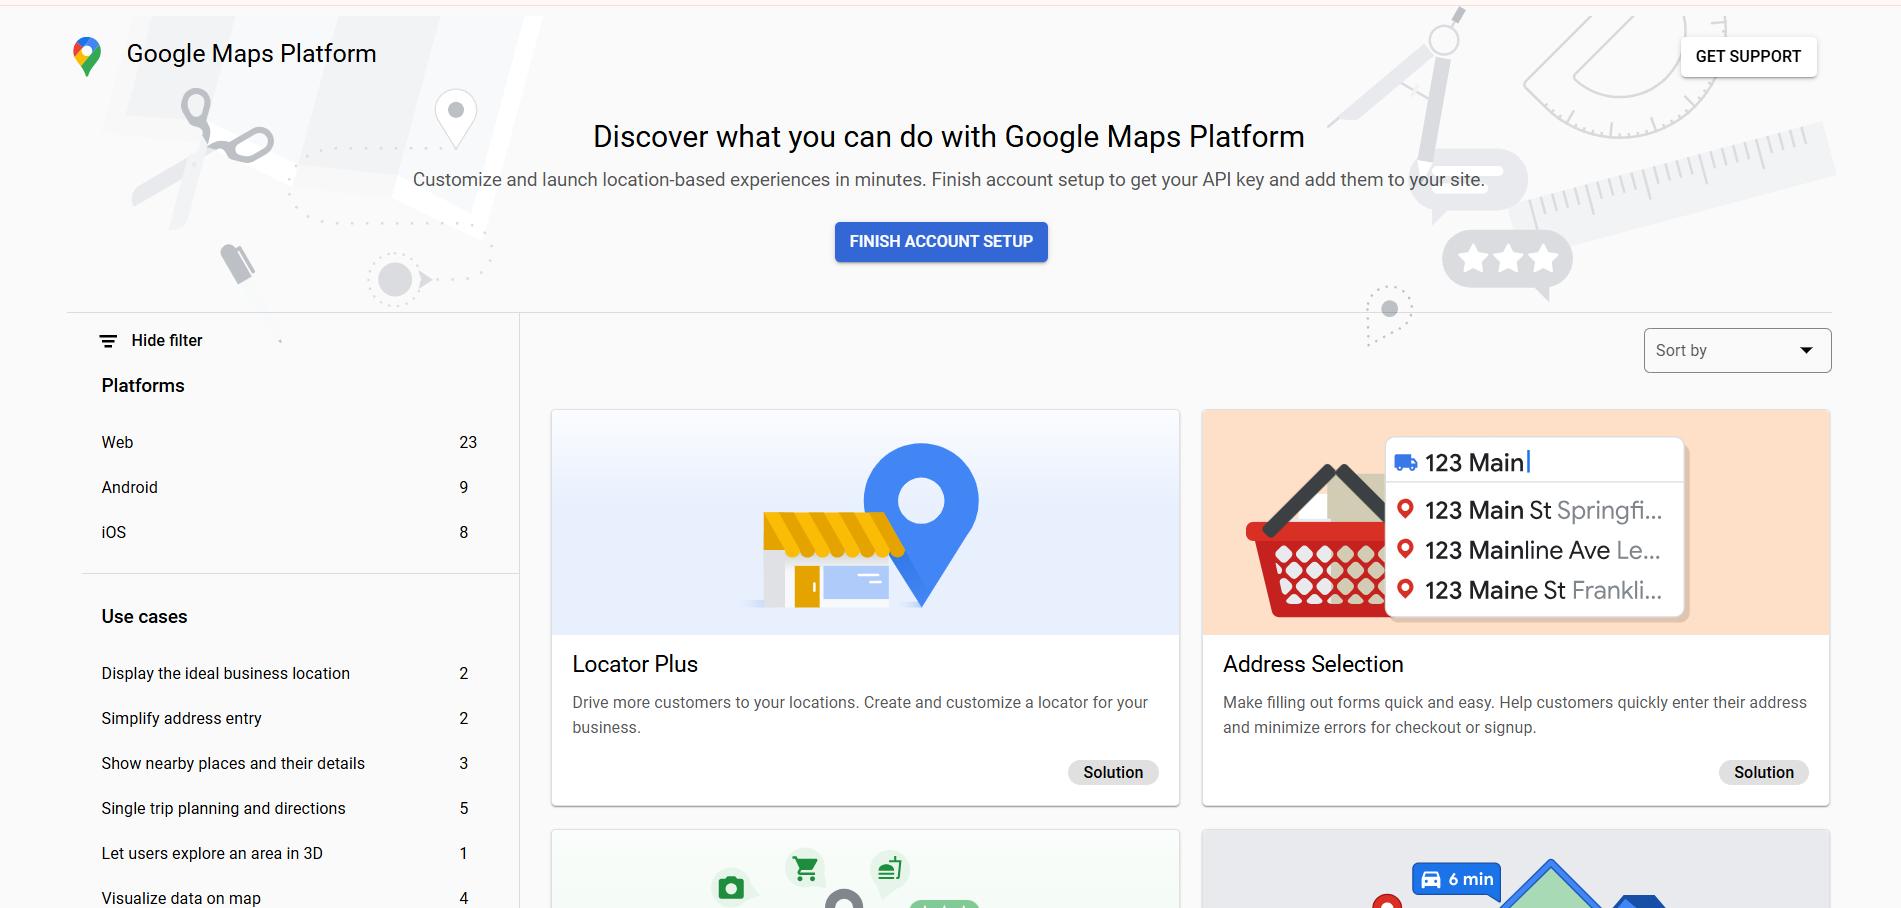
Google Maps API offers tools for designing and deploying geospatial maps that can be easily integrated into websites and applications. It allows users to access and manage spatial data to create customized maps for a more personalized experience. (Image Source)
Web Mapping APIs allow developers to access and control spatial data to create customized maps for websites or apps. Several Web APIs, such as Google Maps and OpenStreetMap, often provide features like map customization, geolocation, and custom markers, which are very helpful in embedding interactive maps.
4. HTML5 and CSS3
HTML5 and CSS3 are essential languages in the process of creating and styling interactive maps
HTML5 provides the structure for embedding maps, and CSS3 ensures they are responsive and visually appealing across different screen sizes.
Types of Interactive Maps
Various interactive maps can suit your needs, whether you are building a static website or a content management system (CMS) site. Each type offers a unique way of creating an interactive map to dynamically visualize data, enabling users to interact with and analyze information seamlessly.
Below are the major types of maps, their distinct features, and their applications for your website.
1. Geographic Maps
Geographic maps convey items relative to their geographic coordinates and present information about a given space, such as physical locations or political boundaries. These interactive maps allow users to zoom, pan, and interact with markers, providing dynamic insights into spatial data.
These maps are best suited for visualizing datasets on specific locations, spatial relationships, or both for education, research, and planning. A geographic map looks like a typical map on Google Maps, including details such as roads, landmarks, and other geographic features. It can be enlarged or reduced according to the user's needs.
Examples of Geographic Maps:
Store Locations or Service Areas Maps
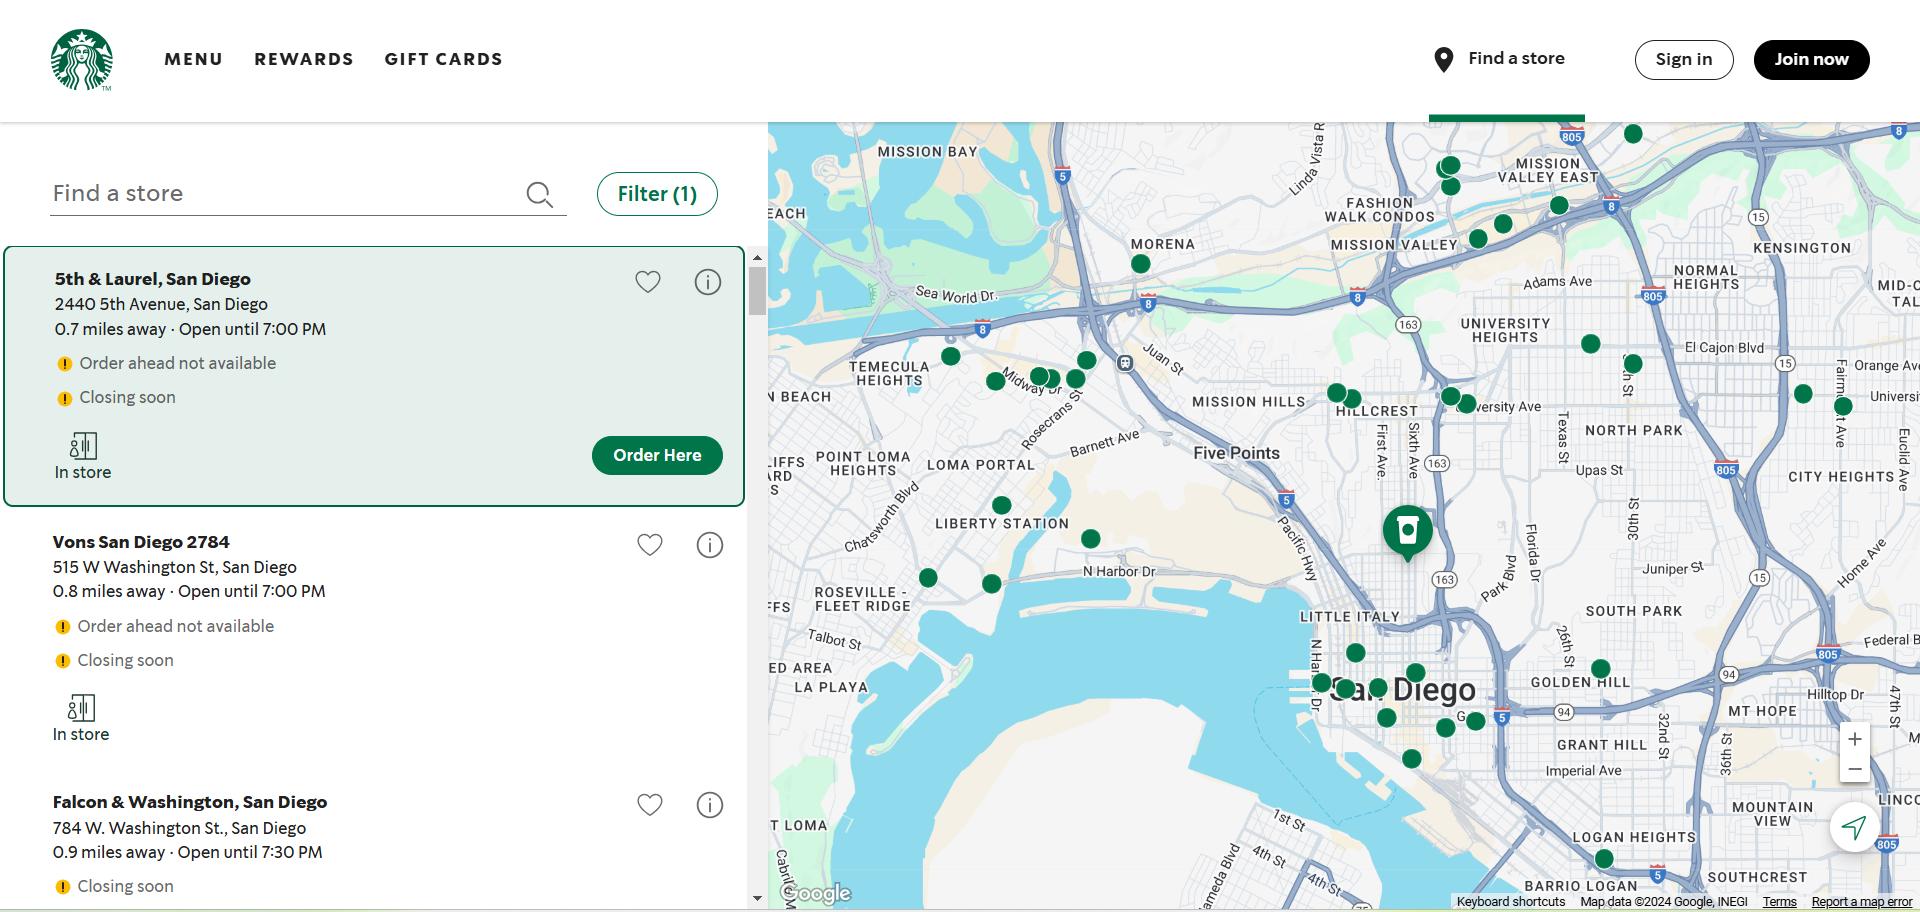
Starbucks offers an easy-to-use interactive map that helps users locate nearby stores, with filters to customize search results. (Image Source)
Display the locations of stores or service areas to help customers easily find nearby locations.
Practical Example: Starbucks Store Locator Map
Comprehensive Street Maps

Google Maps provides a street view option that allows users to explore and see detailed views of streets, public landmarks and locations. (Image Source)
Depict detailed representations of streets, cities, prominent features, and buildings such as intersections, public places, and popular attractions.
Practical Example: Google Maps
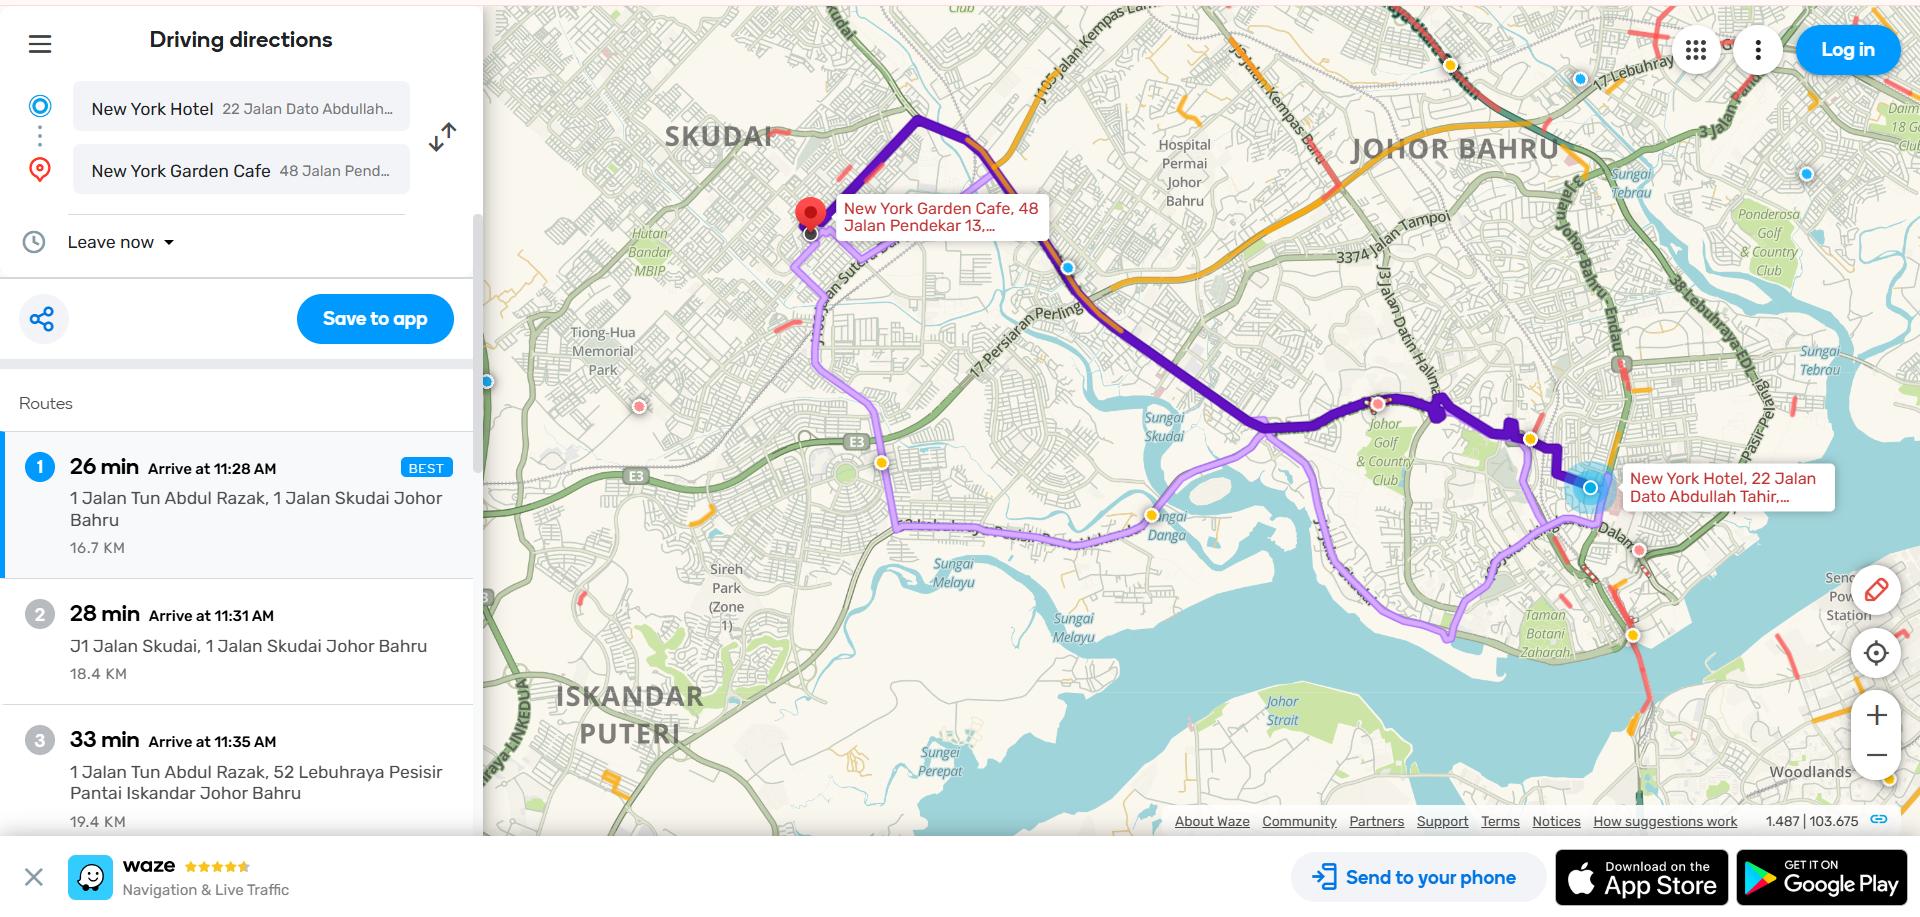
Waze app has real-time traffic updates, offering live information about traffic conditions, road hazards, accidents, and helping users find the best routes to avoid delays. (Image Source)
Provide real-time traffic condition maps showing traffic density, road closures, traffic jams, and other information. These maps help drivers find the best route to their destination and avoid delays.
Practical Example: Waze App
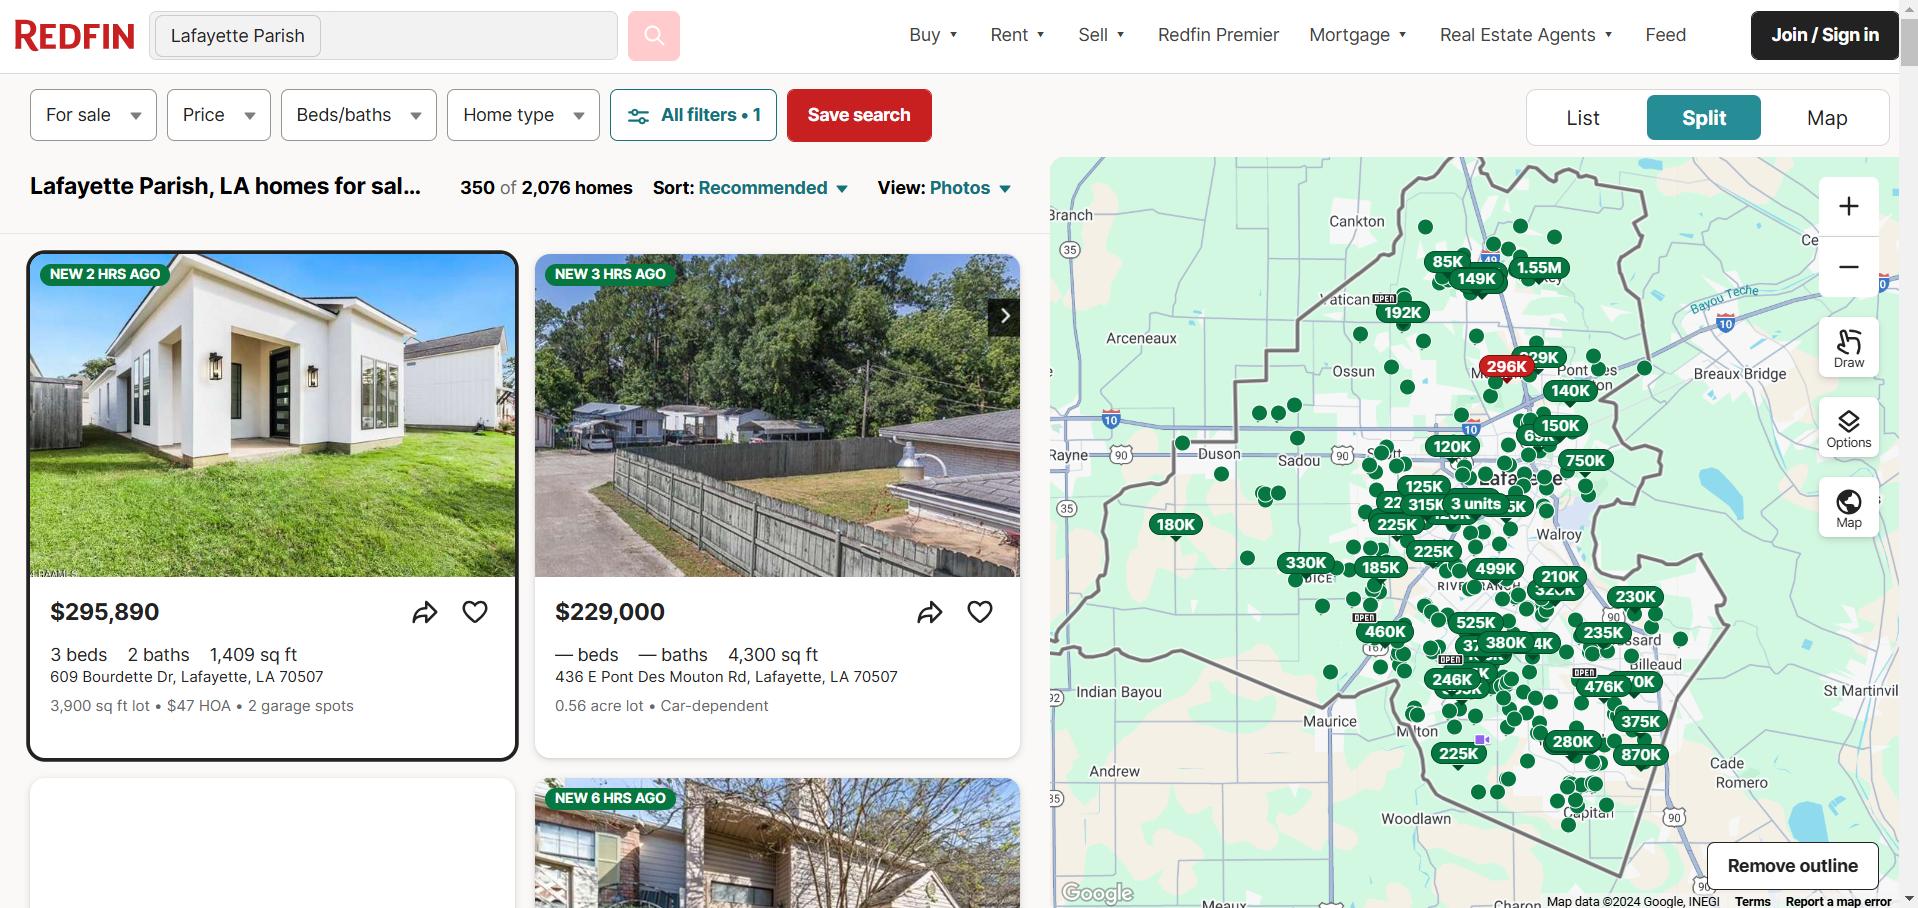
Redfin Real Estate Search Map delivers a comprehensive property search feature that combines maps with property listings. It includes available and unavailable properties for sale or rent, along with a variety of filters, such as price range and other criteria to help refine users' searches (Image Source)
Display maps highlight available and unavailable properties for sale or rent. They often include filter options for price range, property type, and other criteria to help users refine their search and quickly identify ideal properties.
Practical Example: Redfin Real Estate Search Map
2. Thematic Maps
Thematic maps are interactive maps that specialize in visualizing data related to particular themes, such as physical, economic, or geographic statistics and trends. These maps display data within enclosed boundaries, allowing users to identify patterns within regions, states, or continents.
These types of interactive maps display data centered on a single topic or concept. They often include reference information such as location names and features to facilitate comprehension.
Examples of Thematic Maps:
Dot Density Maps
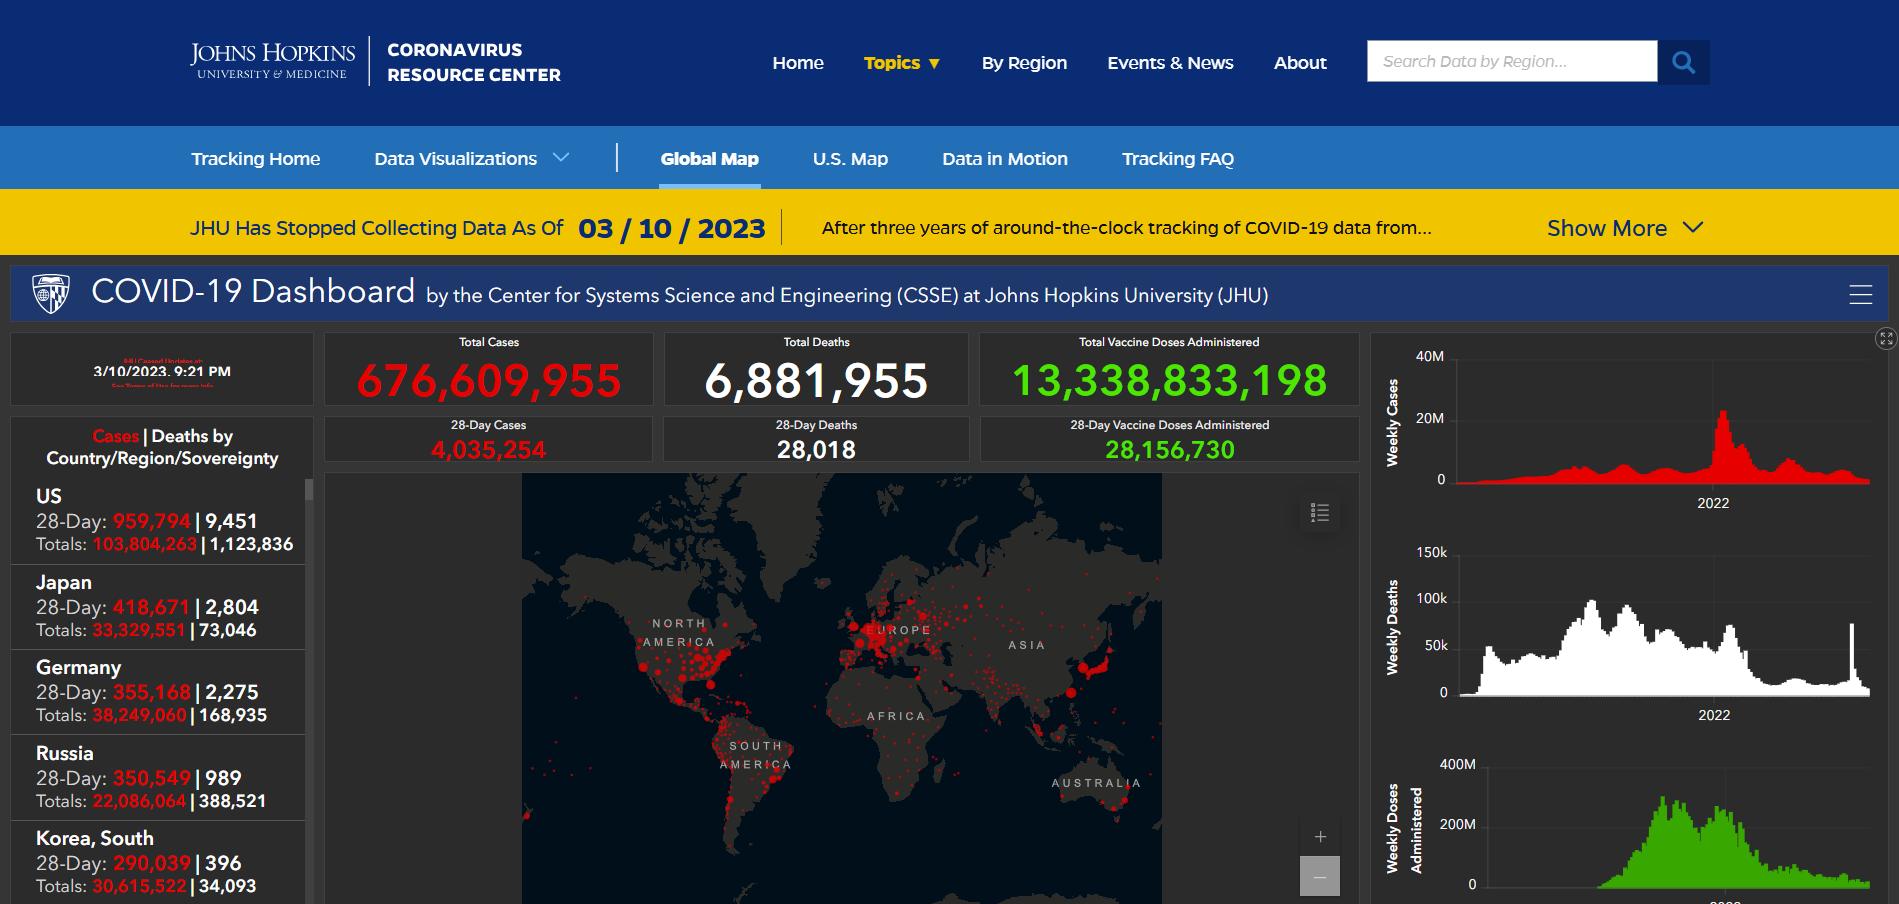
Johns Hopkins Coronavirus Resource Center Map features a comprehensive dot density map showing the total COVID-19 cases worldwide. It also displays additional graphs, including total deaths, weekly doses administered, weekly deaths, weekly cases, and cases and deaths by country. (Image Source)
These maps use dots to visually indicate values from one or more data fields representing density or distribution.
Practical Example: COVID-19 Map - Johns Hopkins Coronavirus Resource Center Map
Economic Metrics Maps
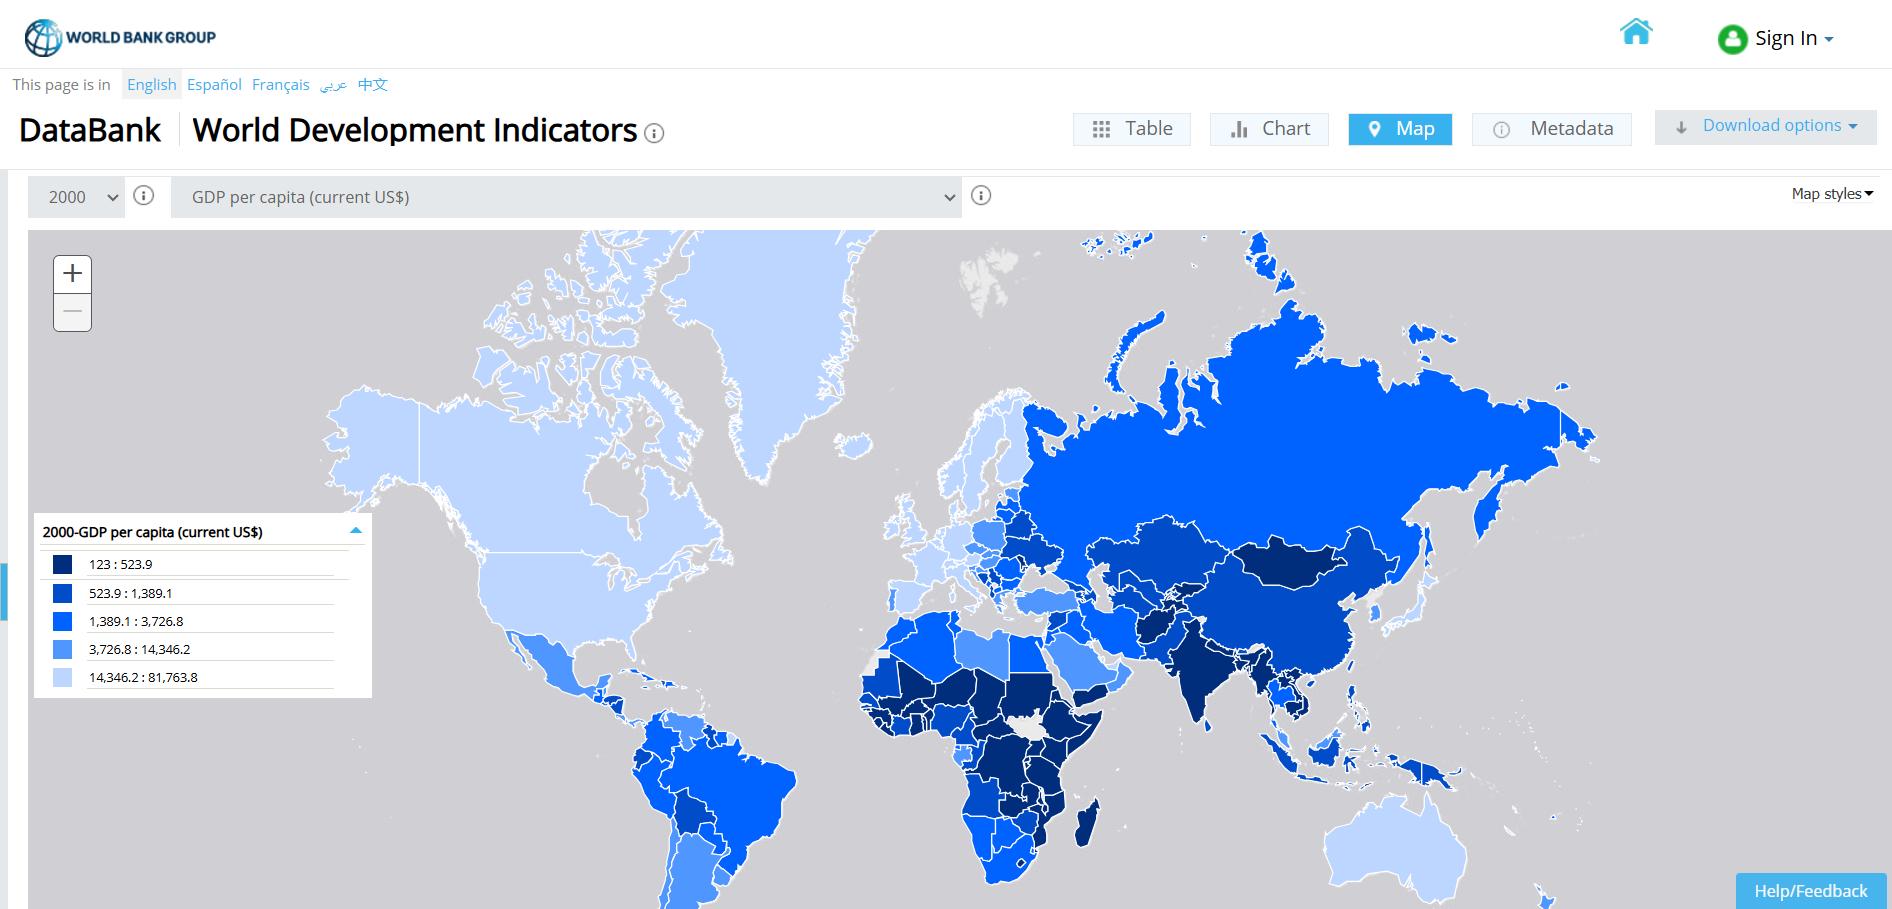
World Bank World Development Indicator Map presents a collection of development indicators assembled from officially recognized international sources. These include GDP per capita, gross capital formation, foreign direct investments, and other financial and development data. (Image Source)
This section features maps highlighting economic trends by displaying income, GDP, and other vital indicators relative to regions and countries compiled from officially acknowledged international sources.
Practical Example: World Bank World Development Indicator Map
Heat Maps
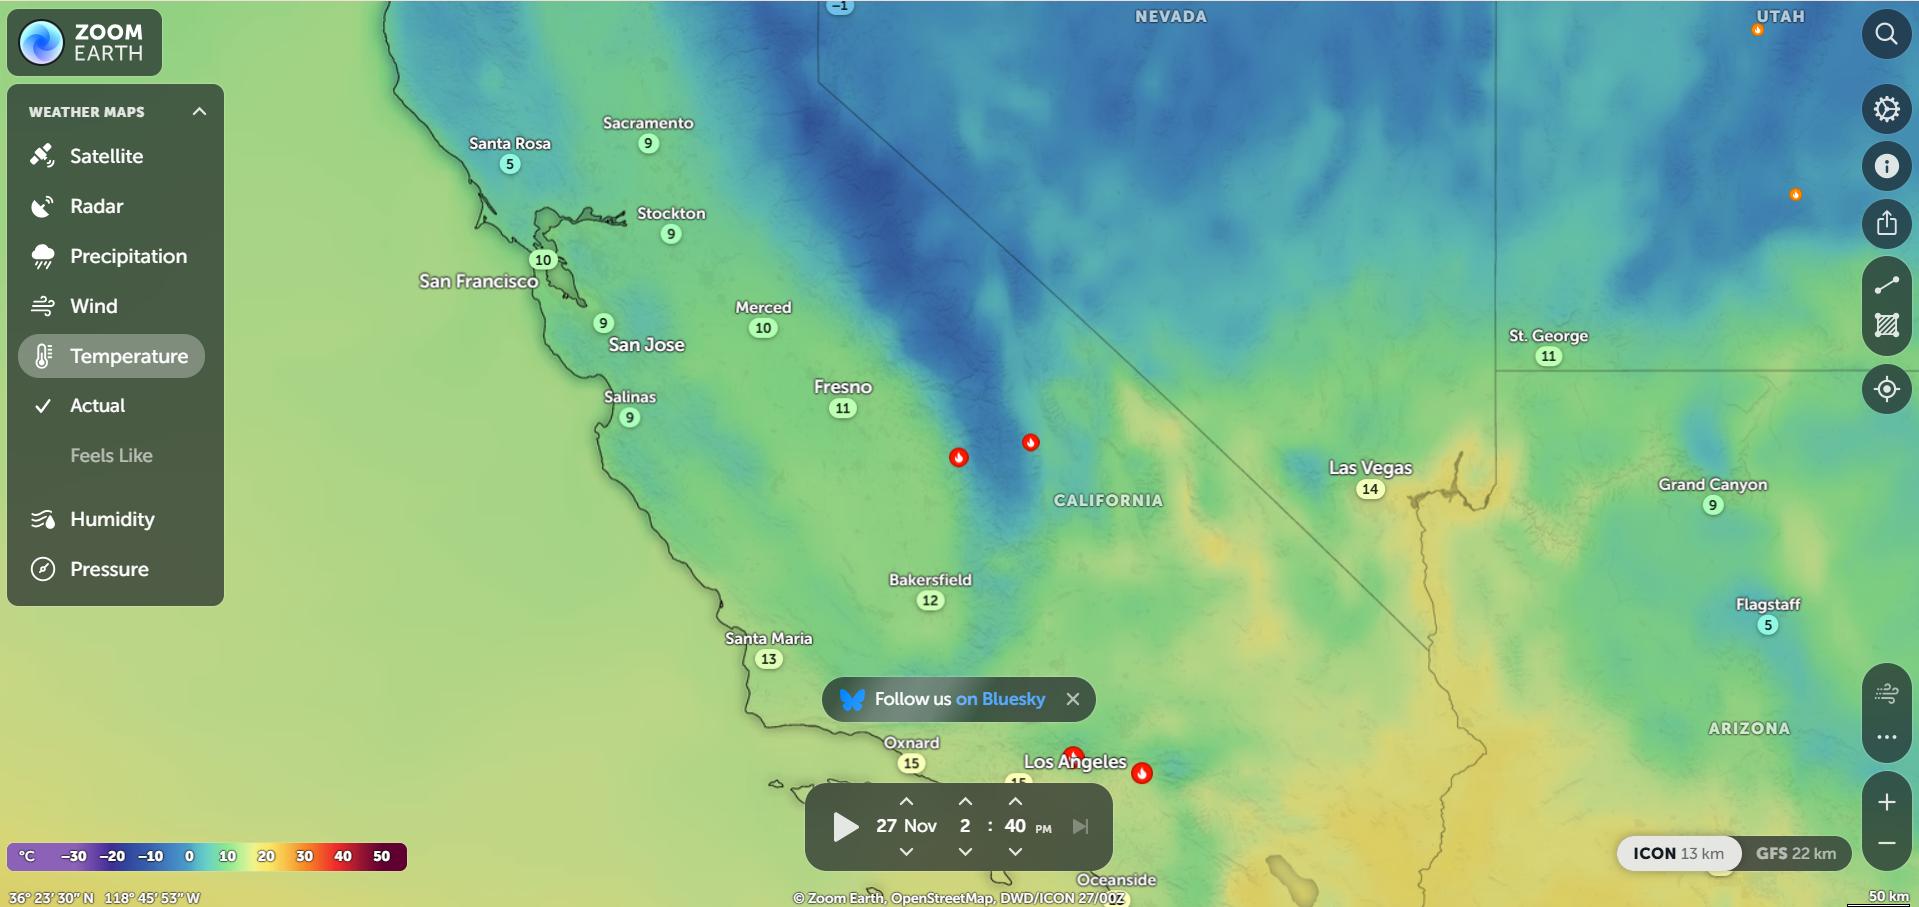
Zoom Earth’s weather features a heat map overlay highlighting areas with extreme temperatures based on satellite data. These temperature points are updated daily using information from NASA LANCE FIRMS. (Image Source)
These maps feature color gradients representing data intensity, making determining trends or extremes in extensive data sets easier.
Practical Example: Zoom Earth Live Weather Map
3. Time-Based Maps
Time-based maps feature interactive visuals that display how location or other geographical information changes over time. These maps are ideal for tracking and evaluating data sets and observing patterns of historical progression.
Creating a time-based map requires setting time intervals that allow people to see how data changes with time. This makes them useful for climate change studies, urban development, and historical trends.
Examples of Time-Based Maps:
Historical Maps
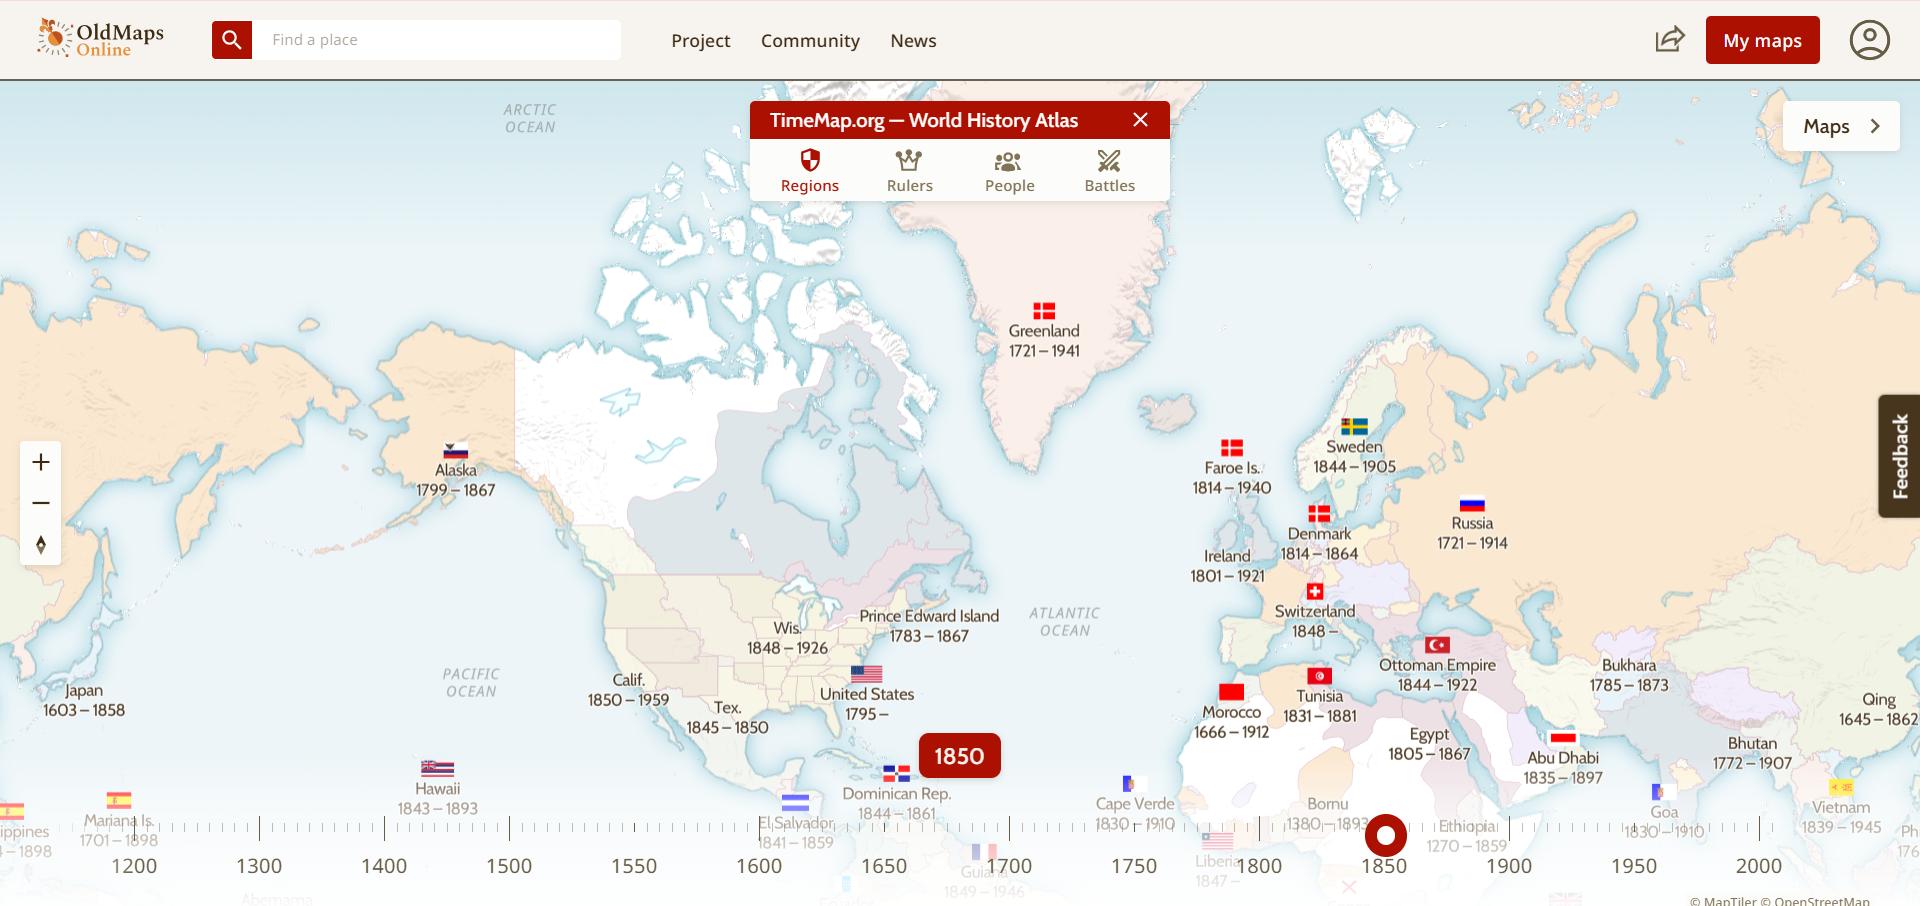
Old Maps Online features a collection of historical maps, timelines, articles, and resources from around the world. Users can explore information about regions, rulers, people, and political development for each timeline. (Image Source)
These maps represent geographical development over specific periods, highlighting the growth and changes in cities and regions. They show alterations in landscapes, infrastructure, and sometimes even cultural or political divisions within regions or countries at a particular point in history.
Practical Example: Old Maps Online
Climate Change Visual Map
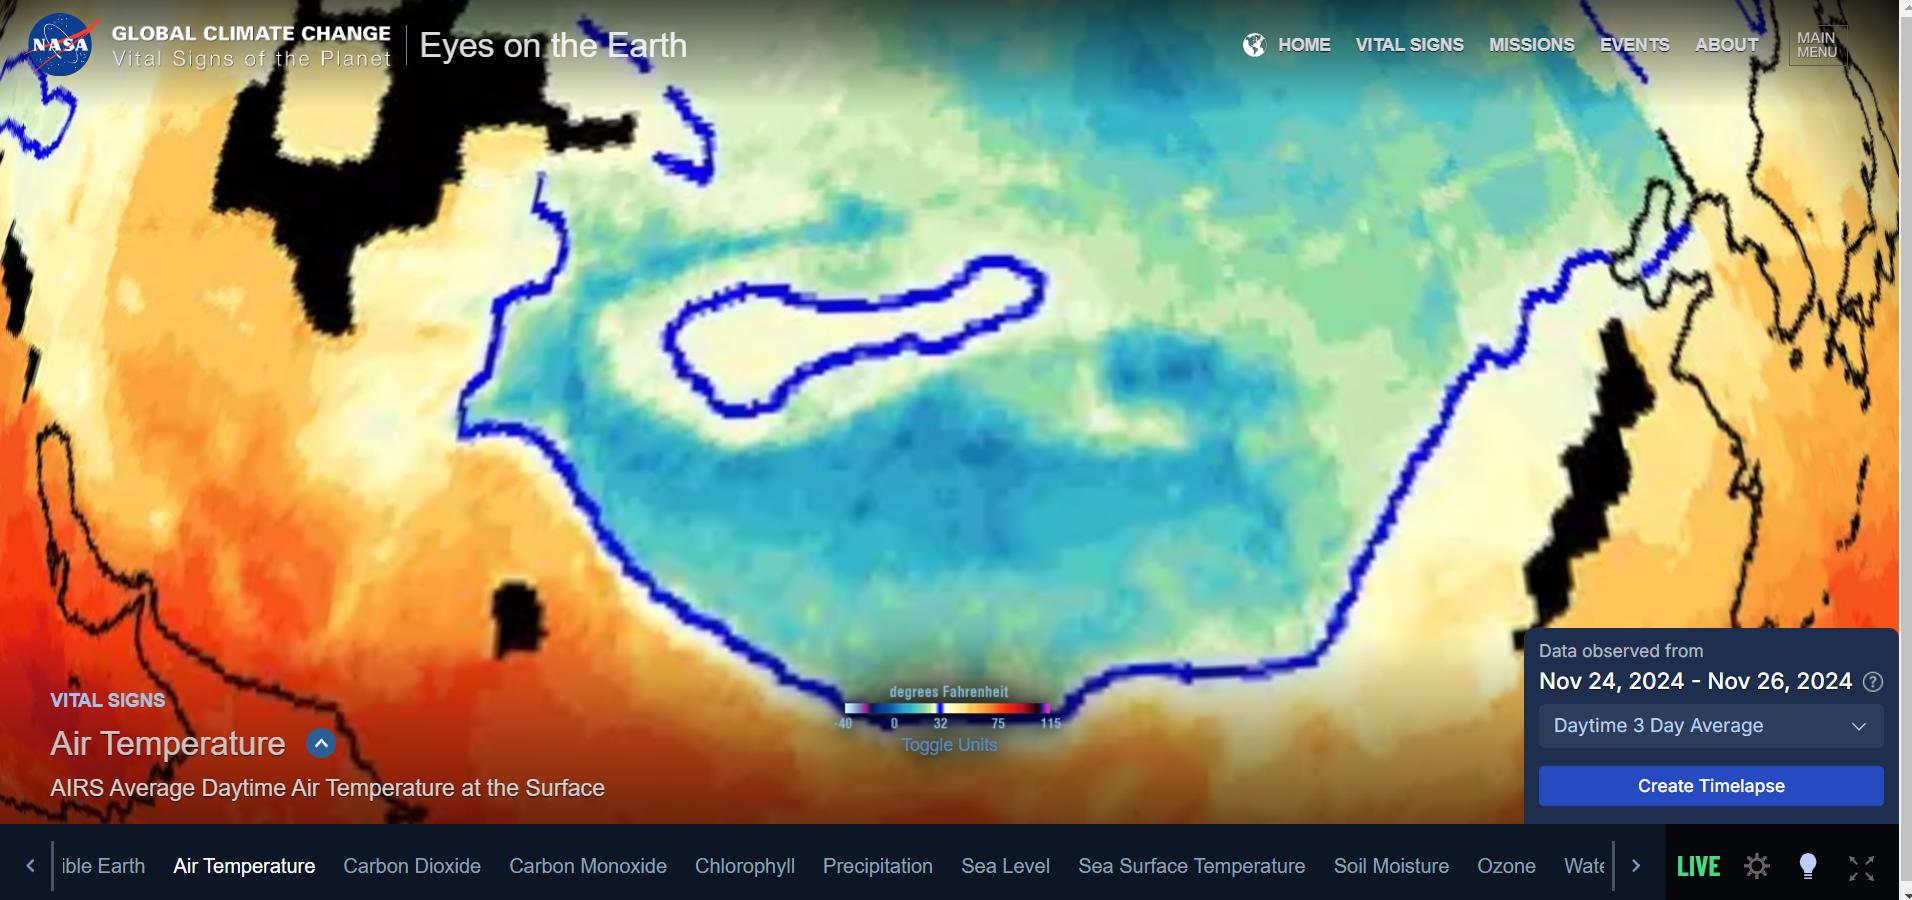
NASA's Earth Now Global Climate Change Map provides real-time or near-real-time data on critical Earth climate indicators. These include air temperature, carbon dioxide level, ozone, and more (Image Source)
Showcase maps that display changes in climate variables, such as temperature changes and rising sea levels over time. These types of maps provide a visual representation of environmental shifts, helping to understand long-term climate trends
Practical Example: NASA's Earth Now Global Climate Change Map
Project Tracking Maps
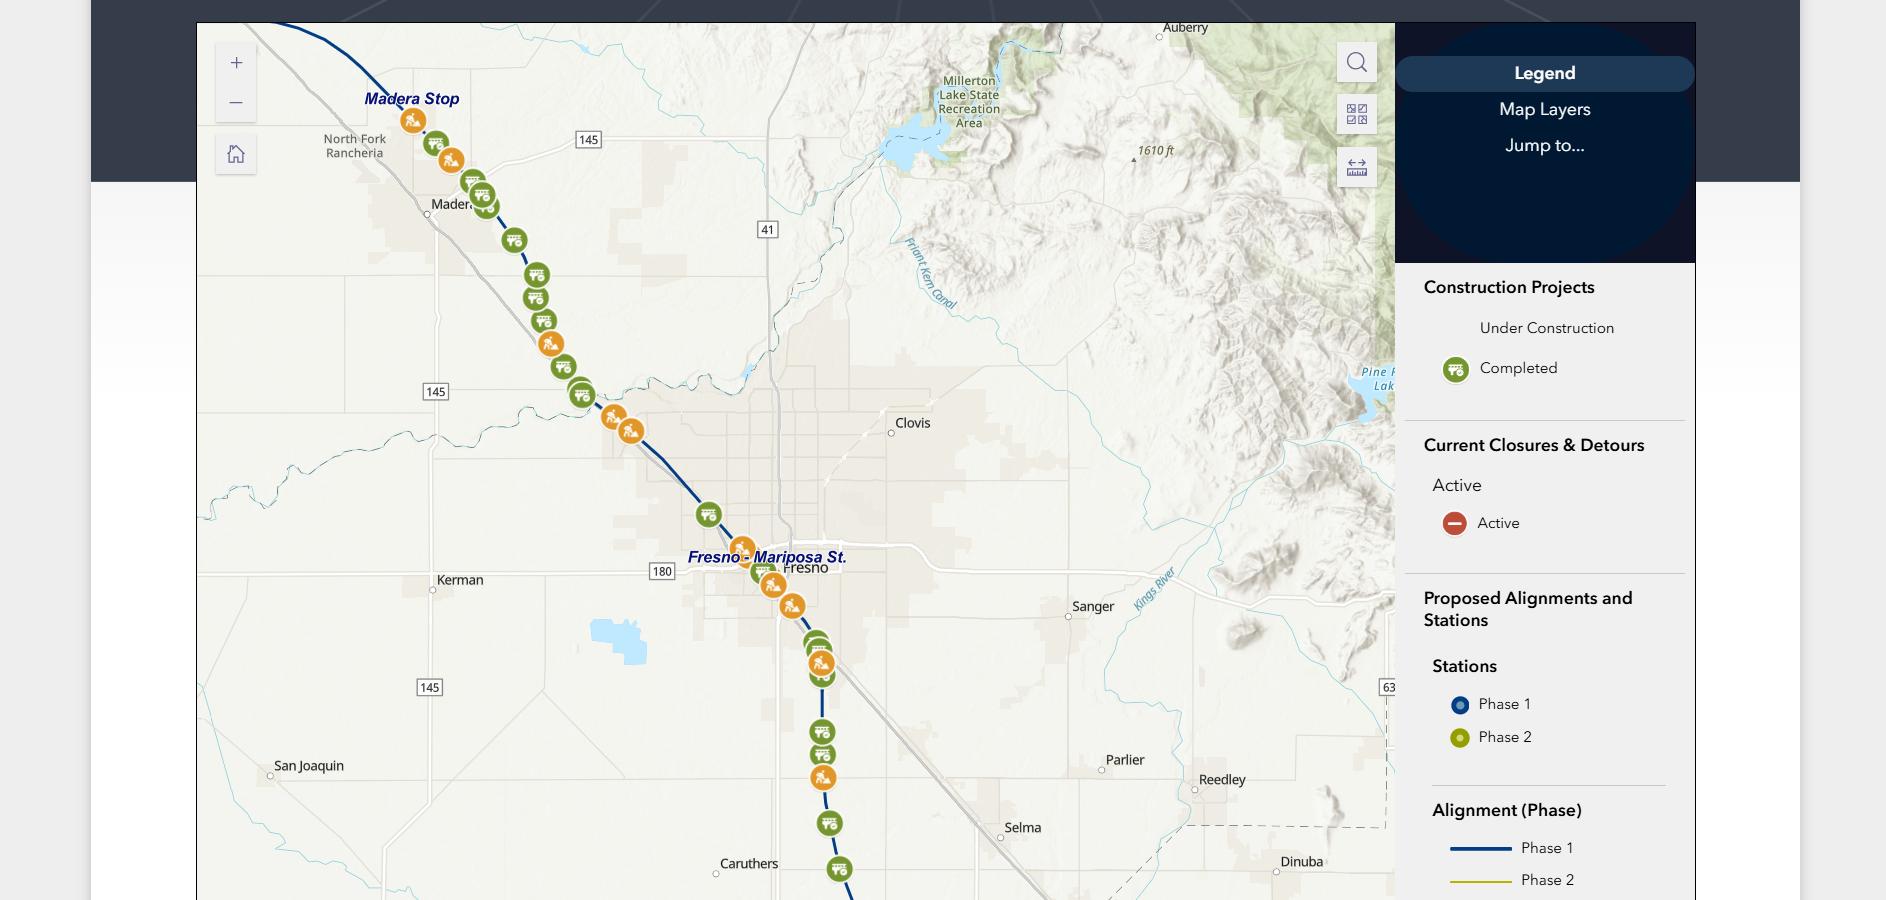
Build HSR Interactive Map provides detailed insights about California's High-Speed Rail construction projects and completed structures. It provides information on various construction packages, updates on active and completed projects, and the phases of alignments and stations. (Image Source)
Present the progression of construction projects by visualizing different development phases. Such maps give insights into the project timelines and construction status at specific periods, helping stakeholders monitor progress and make informed decisions.
Practical Example: Build HSR Interactive Map
How to Create Interactive Maps for Your Website?
To help you get started, we'll guide you through the step-by-step process of creating an interactive map, from selecting the right tools and technologies to implementing them on your website.
Choosing the Right Tools
Different interactive map tools are available online, each with unique features and use cases. You can create a stunning interactive map on your website by choosing the right tool for the job.
Below are some top recommendations to help you get started.
1. Google Maps API
Google Maps API provides APIs and SDKs for creating tailored interactive maps. It offers various products to match your requirements and flexible pricing options that align with your business goals and budget. (Image Source)
The Google Maps API enables seamless integration of interactive features such as geolocation, routing, and a street view, all on a single platform. Its user-friendly interface makes managing multiple maps simple. You can pin addresses, add custom information, and easily embed the map into your website.
This tool suits businesses looking to showcase locations, track real-time movements, or improve online presence with internet-based services.
2. OpenStreetMap API
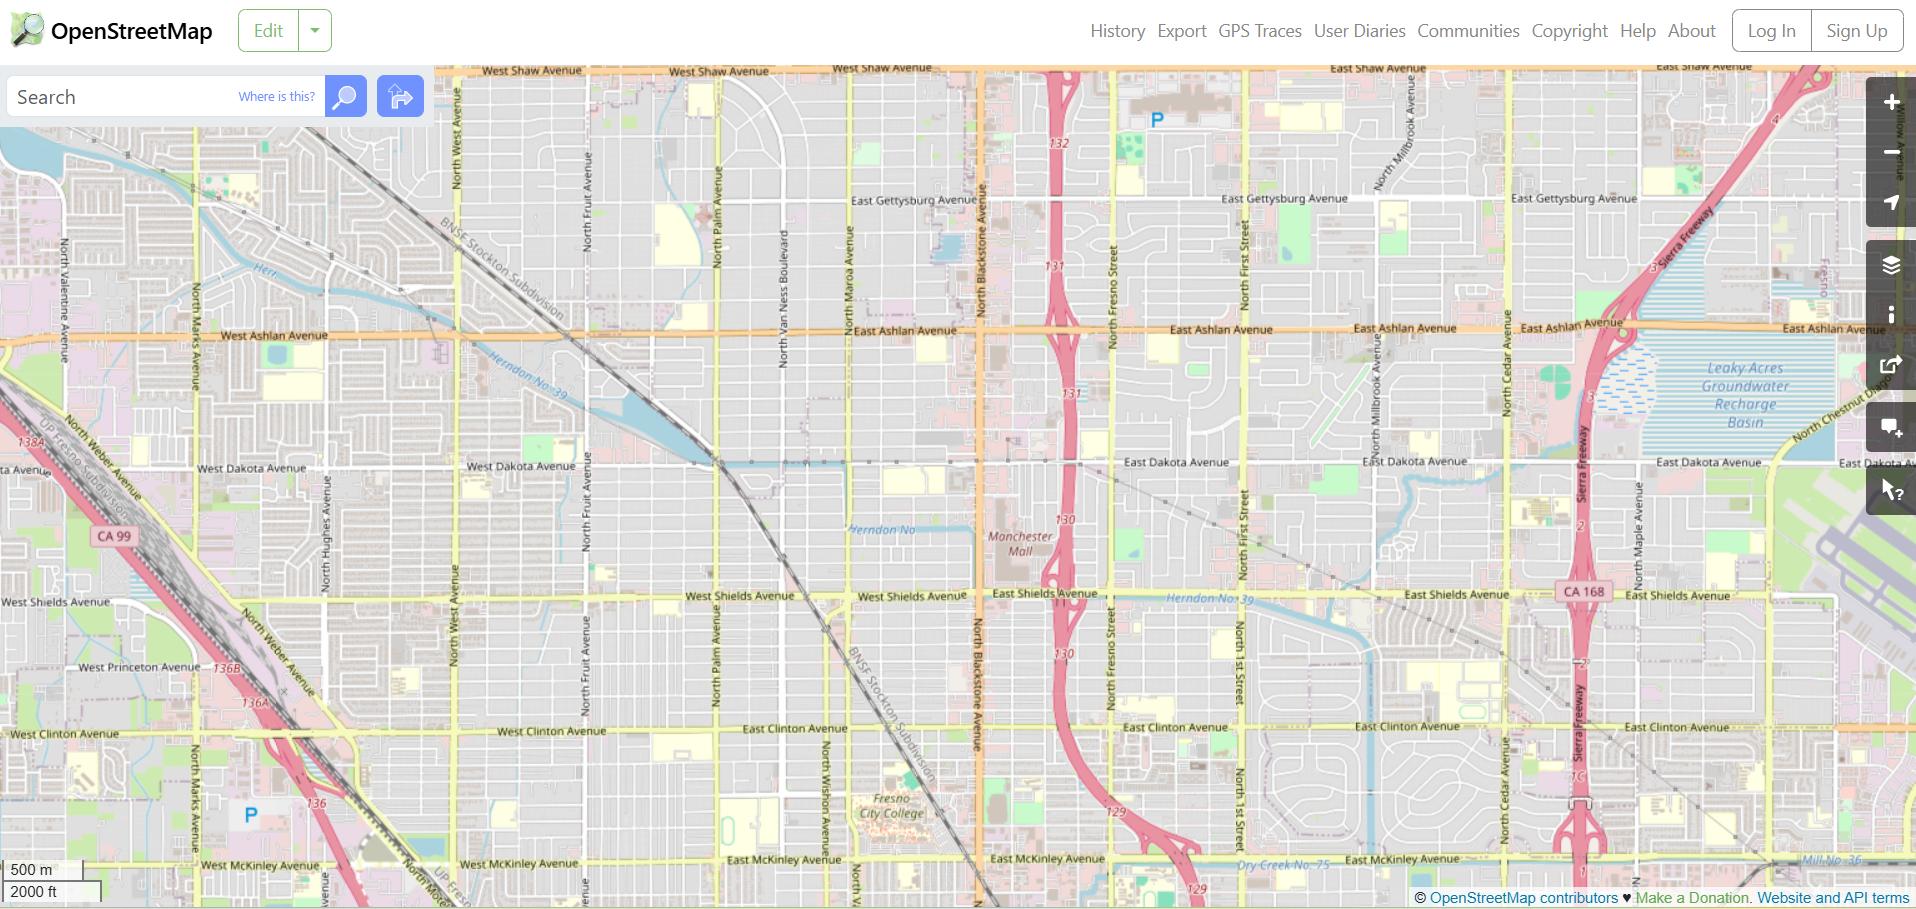
OpenStreetMap offers an open-source web mapping service interface with free, unrestricted access to its data without the need for fees or billing information. It's also an excellent choice for integration with JavaScript libraries like Leaflet.js. (Image Source)
The OpenStreetMap (OSM) API is a perfect alternative to the Google Maps API. It allows developers to access and handle geodata within the OpenStreetMap database and provides an open-source web mapping service interface. Compared to the Google Maps API, OSM offers free, unrestricted access to its data without paying fees or sharing billing information.
This platform is ideal for developers seeking an open-source mapping solution that allows them to use, modify, and integrate maps without licensing restrictions.
3. Mapbox
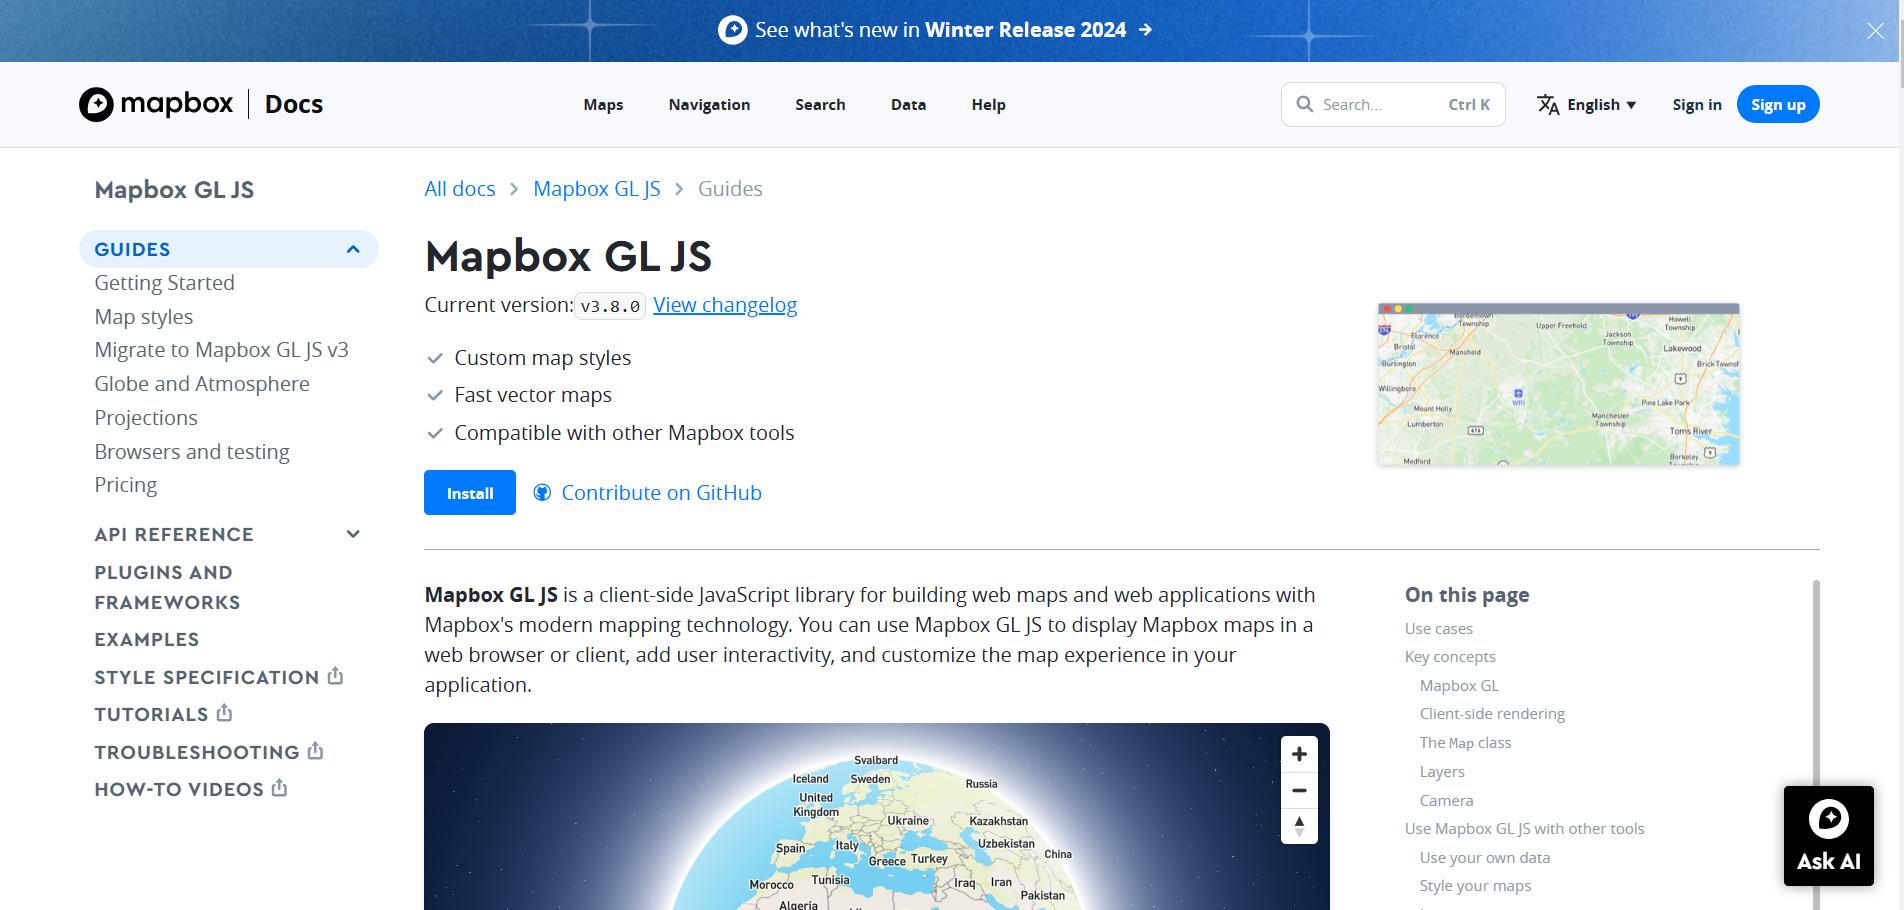
Mapbox GL JS is a client-side JavaScript library designed to create interactive maps for websites and applications. With its robust features and APIs offer an easy way to customize maps tailored to your project needs. (Image Source)
Mapbox is an excellent platform for creating exclusive maps with highly customized features. It allows in-depth customization in design and functionality and supports various map styles, real-time data visualizations, and interactive elements in 2D and 3D formats. This tool is perfect for complex applications, especially for developers with coding and map customization expertise.
4. Leaflet
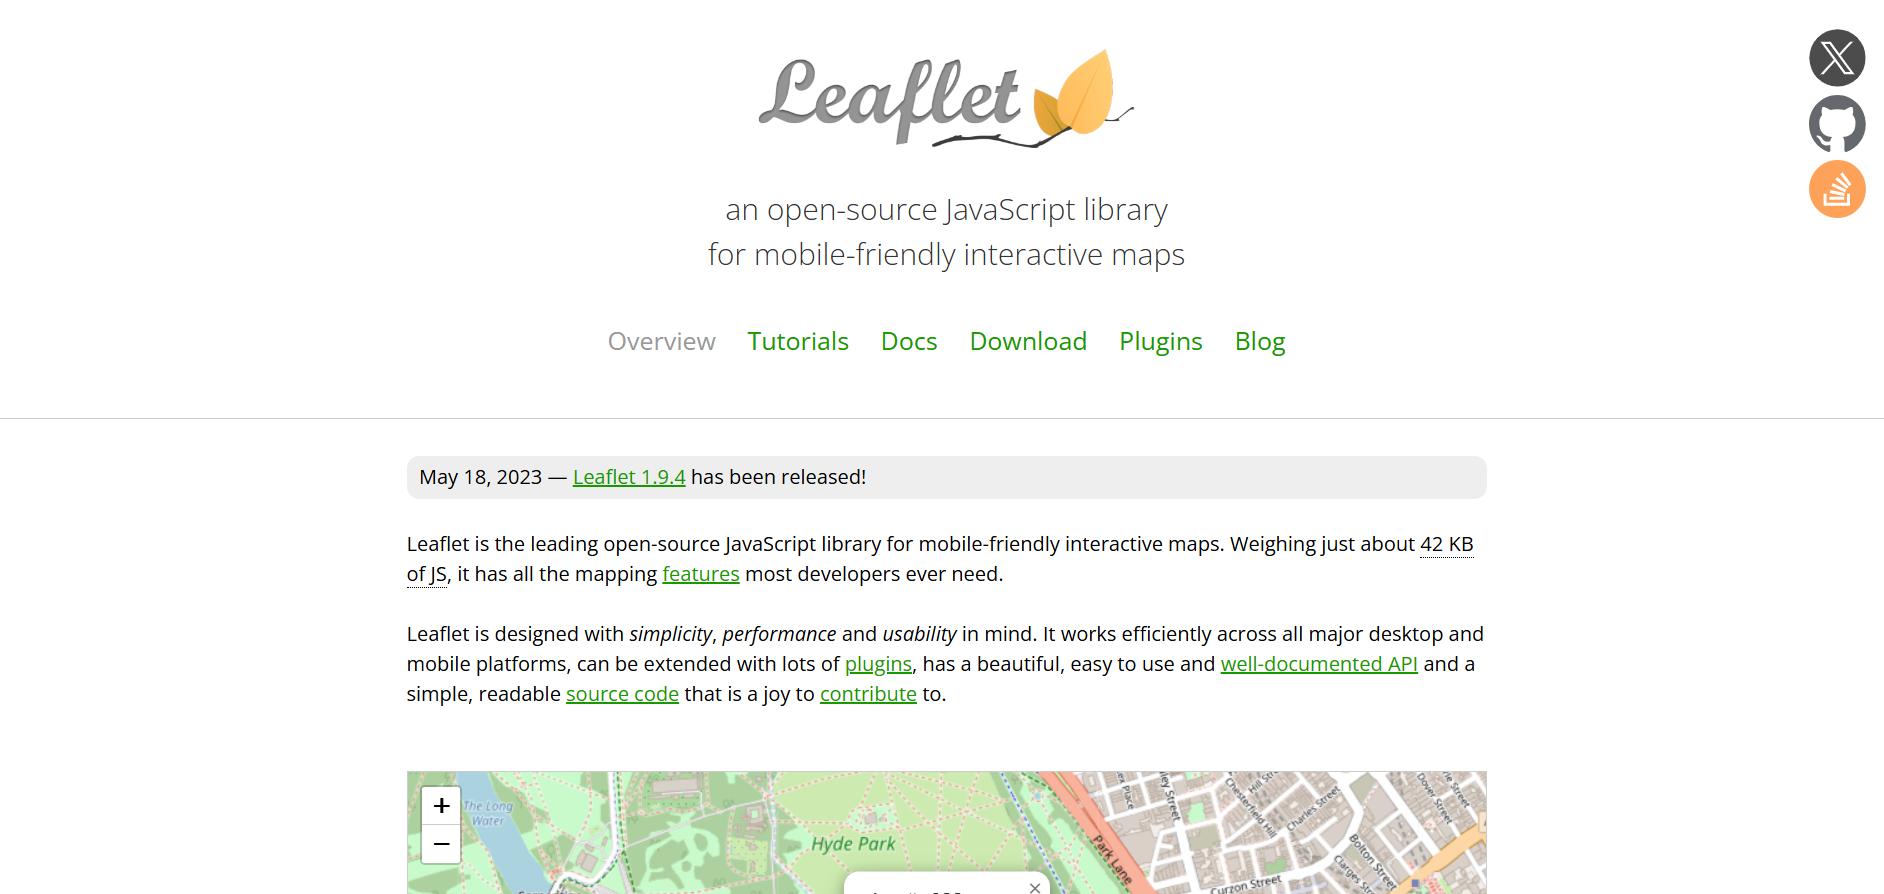
Leaflet is one of the leading open-source JavaScript libraries for creating mobile-friendly interactive maps. It offers an easy-to-use API and robust features, enabling seamless integration of interactive maps. (Image Source)
The leaflet is a lightweight, open-source JavaScript library perfect for creating fully interactive, mobile-friendly maps. It offers functional extensions like tile layers, inserting and styling custom markers, and GeoJSON features. Leaflet can also be integrated with well-known mapping solutions, such as OpenStreetMap.
This is one of the best options for developers who want to create lightweight maps with advanced custom features.
5. ArcGIS
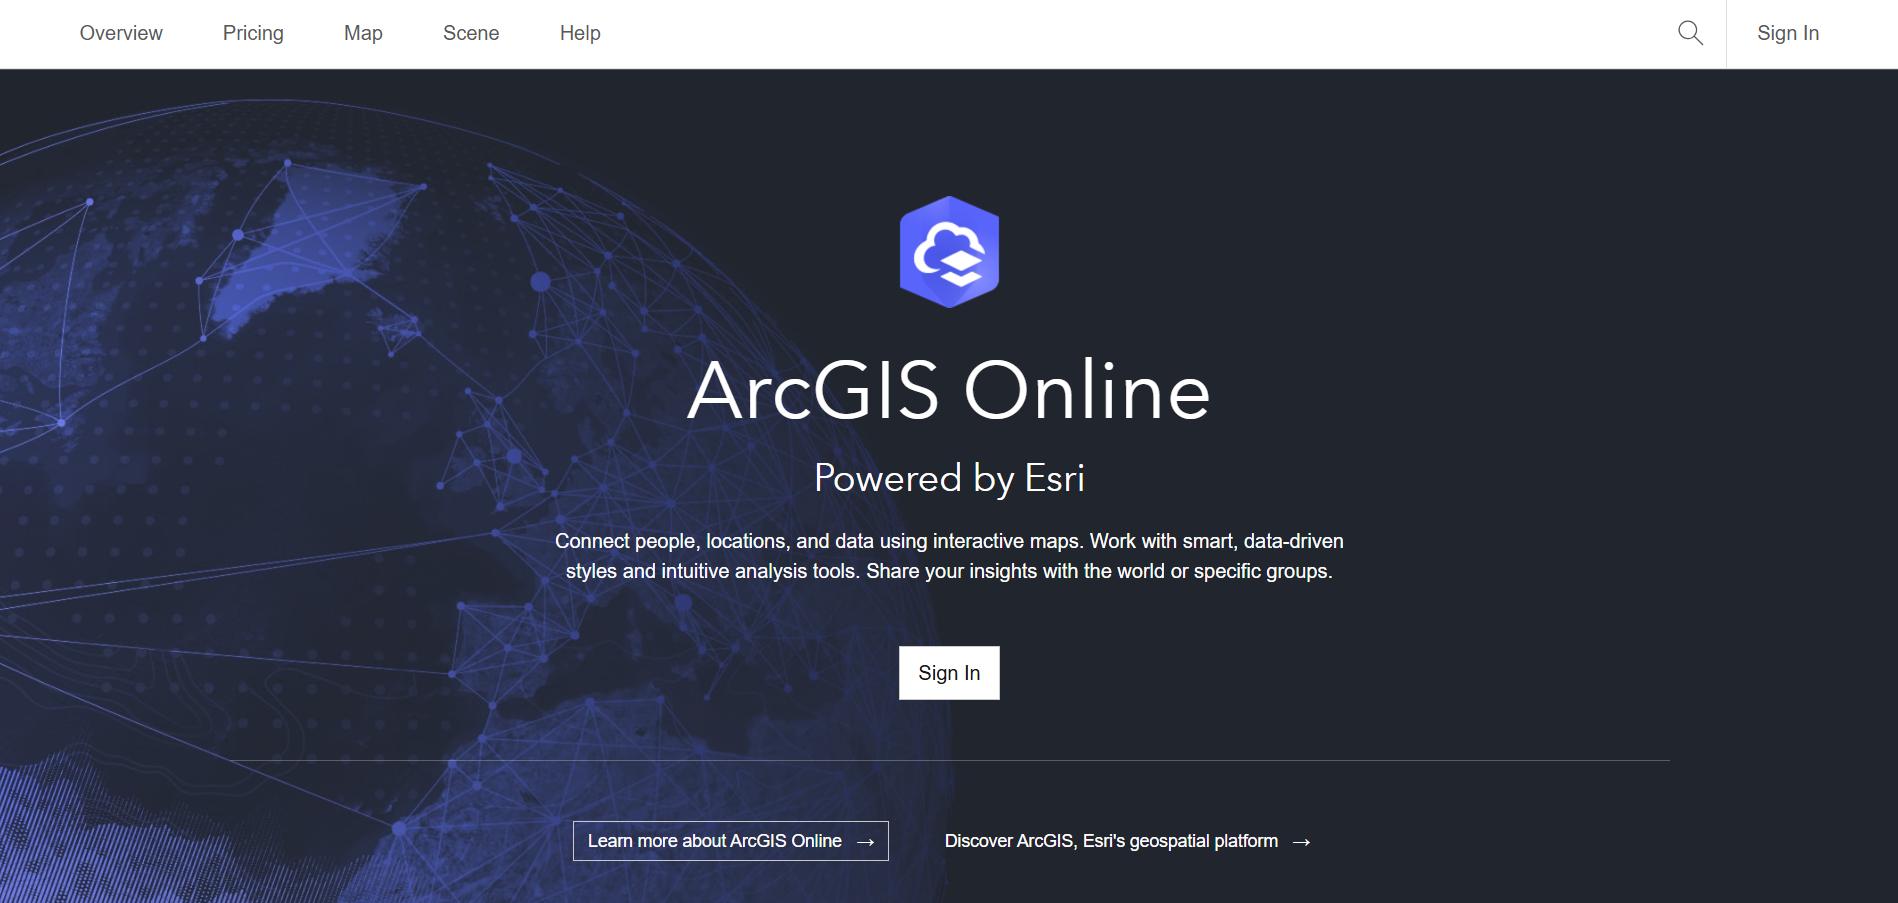
ArcGIS Online is the cloud-based component of the ArcGIS platform, which allows users to create interactive web maps, share spatial data, and collaborate on projects. (Image Source)
ArcGIS is a GIS-based software designed for high-level mapping and analysis. With an ever-evolving ecosystem of tools and functionalities, ArcGIS remains one of the world’s top GIS systems owing to its broad use in comprehensive environmental studies and projects requiring detailed geographic data integration. With its robust and powerful functionality, users can view, edit, manage, and analyze geographical data to look for patterns within the data.
ArcGIS is highly recommended for professionals and organizations with complex, data-driven objectives.
Creating A Simple Interactive Map
If you have a website and want to enhance its functionalities, interactive maps can help. For example, let’s explore the OpenStreetMap (OSM) API with Leaflet.js.
OpenStreetMap is a free and open-source mapping platform, while Leaflet.js is a lightweight JavaScript library for creating interactive maps. Both are essential tools suitable for beginners and professionals alike.
Step 1: Set Up the HTML Structure
Create a new HTML file named index.html and copy the following markup.
<!DOCTYPE html><html lang="en"><head> <meta charset="UTF-8"> <meta name="viewport" content="width=device-width, initial-scale=1.0"> <title>Interactive Map with OpenStreetMap and Leaflet.js</title></head><body> <h1>Interactive Map with OpenStreetMap and Leaflet.js</h1> <div id="map"></div></body></html>This line of code will create a div with id of map where the OpenStreetMap will be embedded.
Step 2: Include the Leaflet.js library in your project
Add the Leaflet.js CSS CDN link within the <head> section and the Leaflet.js JavaScript DN link right before the closing </body> tag.
To set the size of the OpenStreetMap, indicate the width and height of the map container using CSS inside the <style> tag.
<!DOCTYPE html><html lang="en"><head> <meta charset="UTF-8"> <meta name="viewport" content="width=device-width, initial-scale=1.0"> <title>Interactive Map with OpenStreetMap and Leaflet.js</title> <!-- Leaflet CSS --> <link rel="stylesheet" href="https://unpkg.com/leaflet/dist/leaflet.css" /> </head><body> <h1>Interactive Map with OpenStreetMap and Leaflet.js</h1> <div id="map"></div> <style> h1 { font-family: 'Poppins', sans-serif; text-align: center; } /* Set the size of the map container */ #map { width: 100%; /* Set the width to 100% of the container */ height: 600px; /* Set a specific height for the map */ } </style> <!-- Leaflet JavaScript --> <script src="https://unpkg.com/leaflet/dist/leaflet.js"></script></body></html>Step 3: Initialize and add the tiles for OpenStreetMap
Add the following code after the Leaflet.js JavaScript CDN link (placed just before the closing </body> tag).
This code initializes an OpenStreetMap instance, sets its view to a specific location and zoom level, and loads map tiles provided by OpenStreetMap.
// Initialize the map and set its view to a specific location and zoom levelconst map = L.map('map').setView([36.7854, -119.7922], 15); // Coordinates: Latitude, Longitude; Zoom level: 13 // Add OpenStreetMap tiles to the mapL.tileLayer('https://{s}.tile.openstreetmap.org/{z}/{x}/{y}.png', {attribution: '© OpenStreetMap contributors',}).addTo(map);Note: The coordinates used in the code above represent Fresno, California, USA. You can replace them with the coordinates of any location you prefer.
Step 4: Add Map Interactivity Functions for Leaflet.js
In addition to the basic map setup, you can improve OpenStreetMap's interactivity by adding a Leaflet.js pop-up marker function at a specific location. This will allow users to click on the marker and view additional information about the area.
Add the following code to the OpenStreetMap's tiles codes to implement this.
// Add a marker to the map at the same locationconst marker = L.marker([36.7854, -119.7922]).addTo(map);marker.bindPopup("<b>EAST GARLAND AVENUE</b><br>This is the location marker for <br/>East Garland Avenue Parking Lot. ").openPopup();Another useful Leaflet.js feature is highlighting a specific location through a circle overlay function. A pop-up marker with information about that location will appear when users click on the circle.
You can include the following code after the pop-up marker function:
// Add a circle overlay to a different location const circle = L.circle([36.787833, -119.782712], { color: 'red', fillColor: '#f03', fillOpacity: 0.5, radius: 100, }).addTo(map); circle.bindPopup("<b>MANCHESTER GATE ELEMENTARY SCHOOL</b><br>This is a circle overlay for <br/>Manchester Gate Elementary School.");Helpful Tips: To learn additional functions and features for this map, explore the OpenStreetMap and Leaflet.js documentation for more interactive options.
Step 5: Publish the HTML File
Once you've finished editing, save and upload your index.html file to a web server. After uploading, open the file in a browser to view and interact with your map.
It should look like the example shown below.
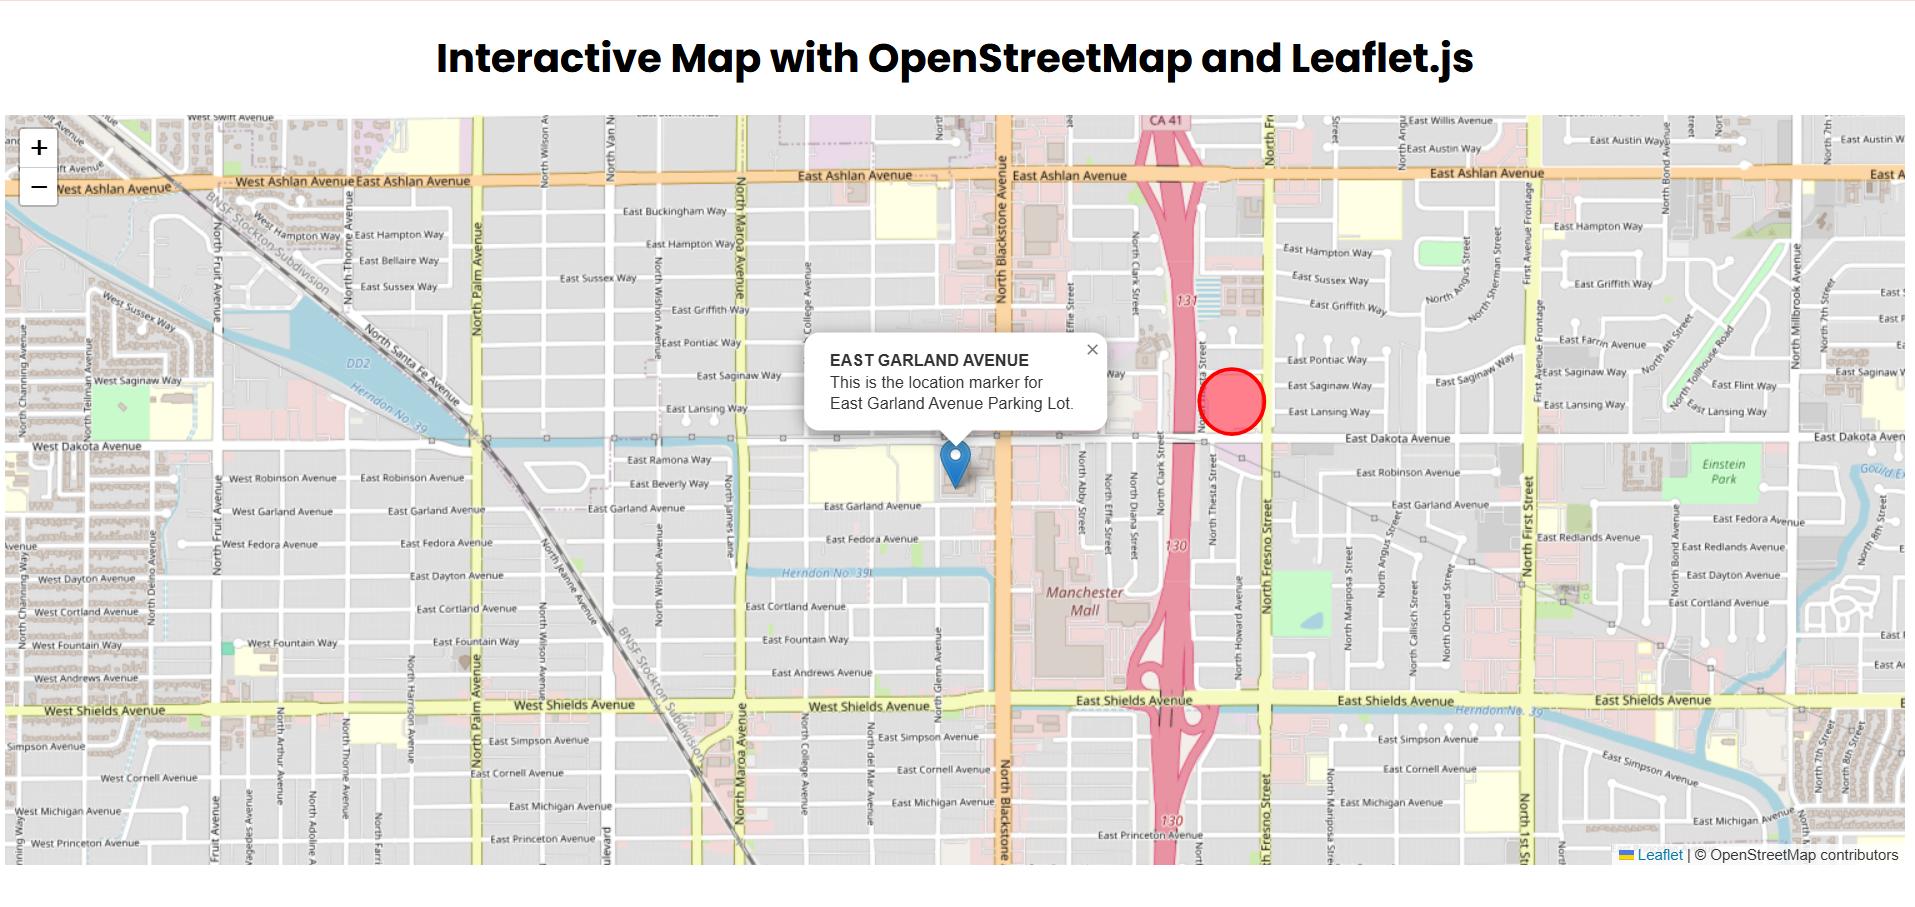
Demo screenshot of the interactive map created with OpenStreetMap and Leaflet.js, demonstrating the process of building a simple interactive map for websites.
Excellent Examples of Interactive Maps
Below is a list of some of the best interactive maps with brief descriptions and visual references to demonstrate their features and design.
Example #1: New York Times Coronavirus World Map
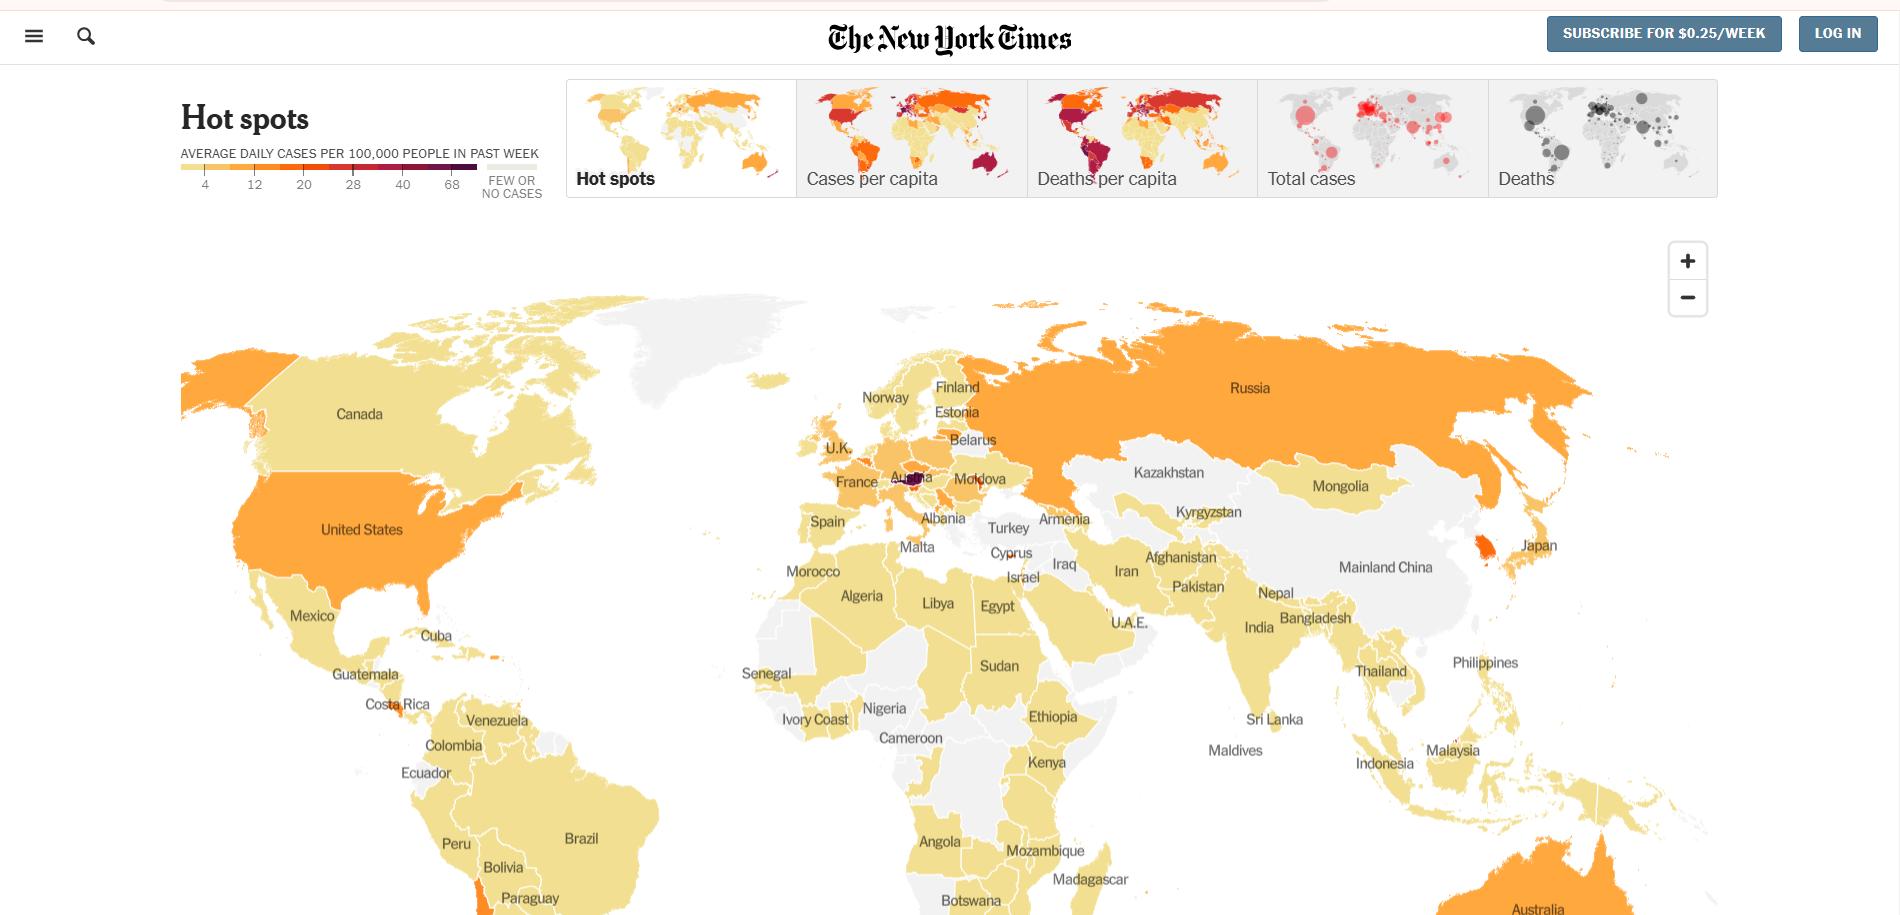
Interactive Coronavirus World Map developed by the New York Times offers a detailed, real-time view of COVID-19 cases, deaths, hotspots, and vaccination progress across the world. (Image Source)
The Interactive Coronavirus World Map developed by the New York Times allows users to get detailed maps and graphs to track COVID-19 trends across specific areas. Updated regularly with the latest country data on cases, deaths, hot spots, and vaccinations, it provides a visually intuitive way to understand the spread and severity of the pandemic.
Key Features:
- Color-coded regions indicating infection rates
- Interactive sliders and filters to explore data over time
- Real-time updates for accurate tracking
- Per capita chart visualizations
- Hot spot mapping for critical areas
- Responsive map design
Example #2: Zillow’s Real Estate Map
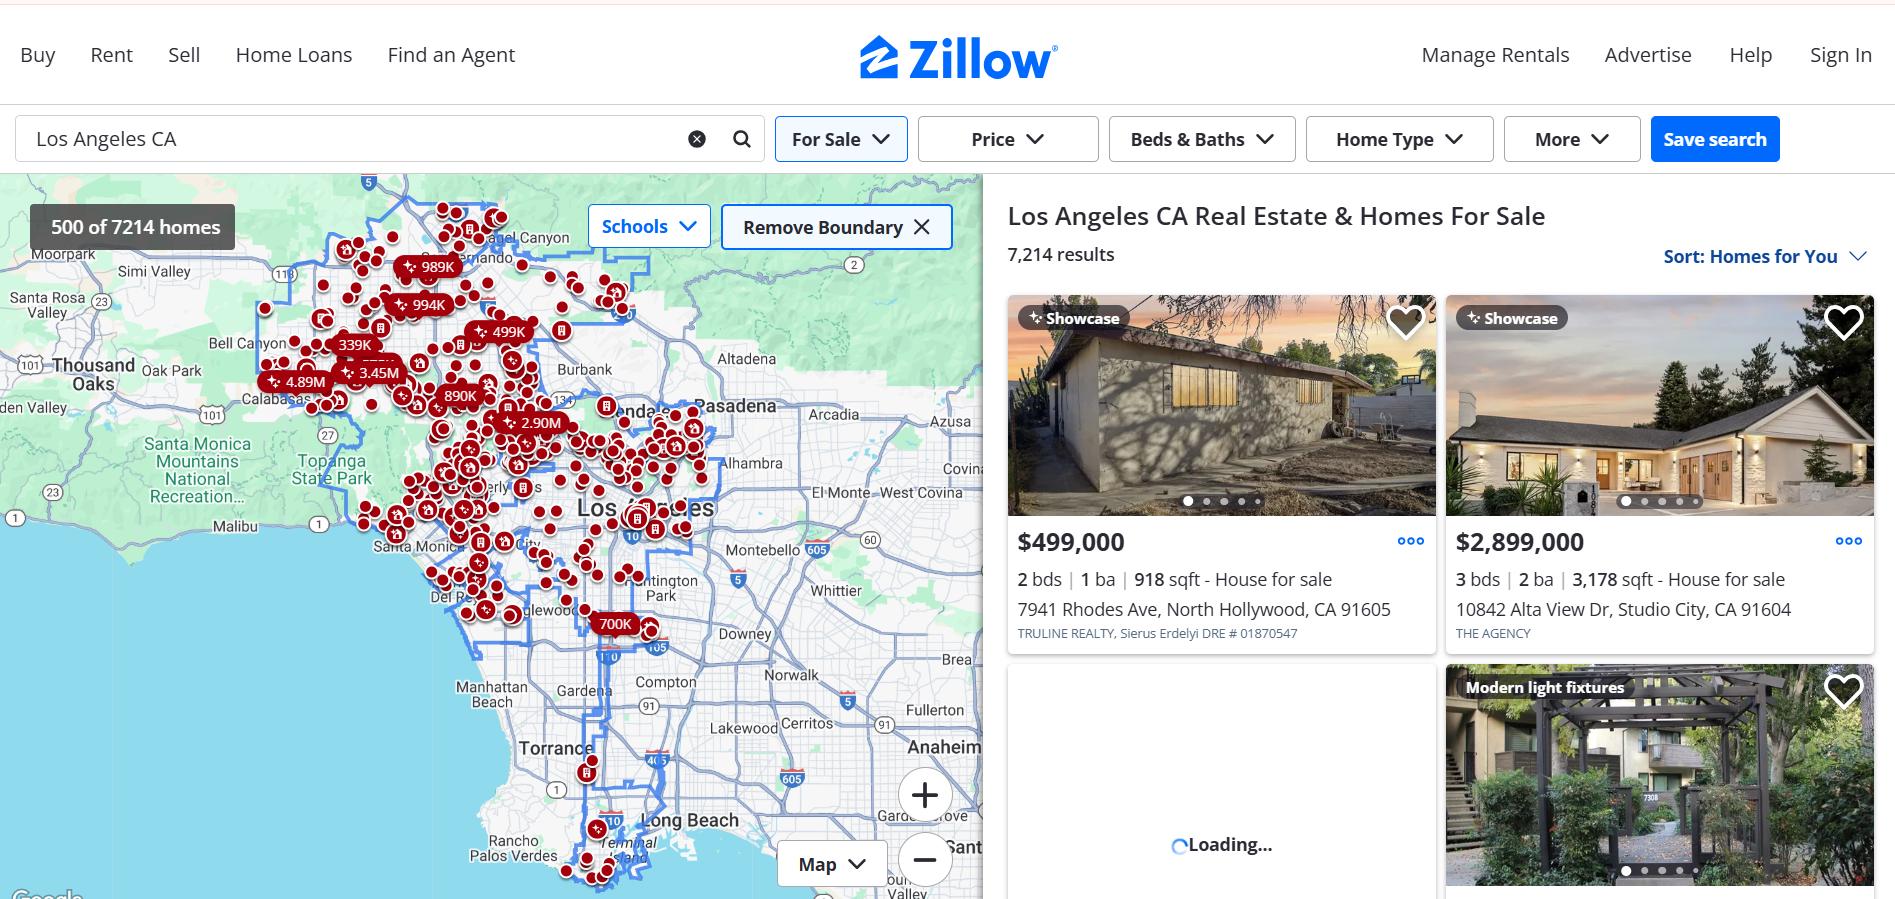
Zillow interactive map integrates geographical data with real estate listings, offering helpful filters to help users find the ideal property. Through its interactive features, users can easily explore locations and access detailed information, such as home value estimates, prices, photos, and property descriptions. (Image Source)
The Zillow map combines geographical data with real estate listings, simplifying property searches and enhancing the user experience. Through its interactive features, users can easily explore locations and access detailed information, such as home value estimates, prices, photos, and property descriptions—all directly from the map interface. Also included are standard map features that provide tools like filters, zooming, and panning for easy navigation across the map.
Key Features:
- Dot map visuals to display location variables across areas
- Advanced filters for price ranges, property types, and neighborhoods
- Pop-up windows with carousel photos, prices, addresses, and estimated values
- Google Maps-style navigation with integrated street views
- Boundary removal and map re-centering options
- Save locations using the “like” or “heart” feature
Best Practices for Integrating Interactive Maps
Interactive maps are a robust way of visualizing and leveraging geographical information for the targeted audience. However, poor implementation can lead to user frustration and a higher bounce rate.
To help you avoid these pitfalls, here are some best practices for integrating interactive maps into your website or application.
Implement Responsive Web Design Principle
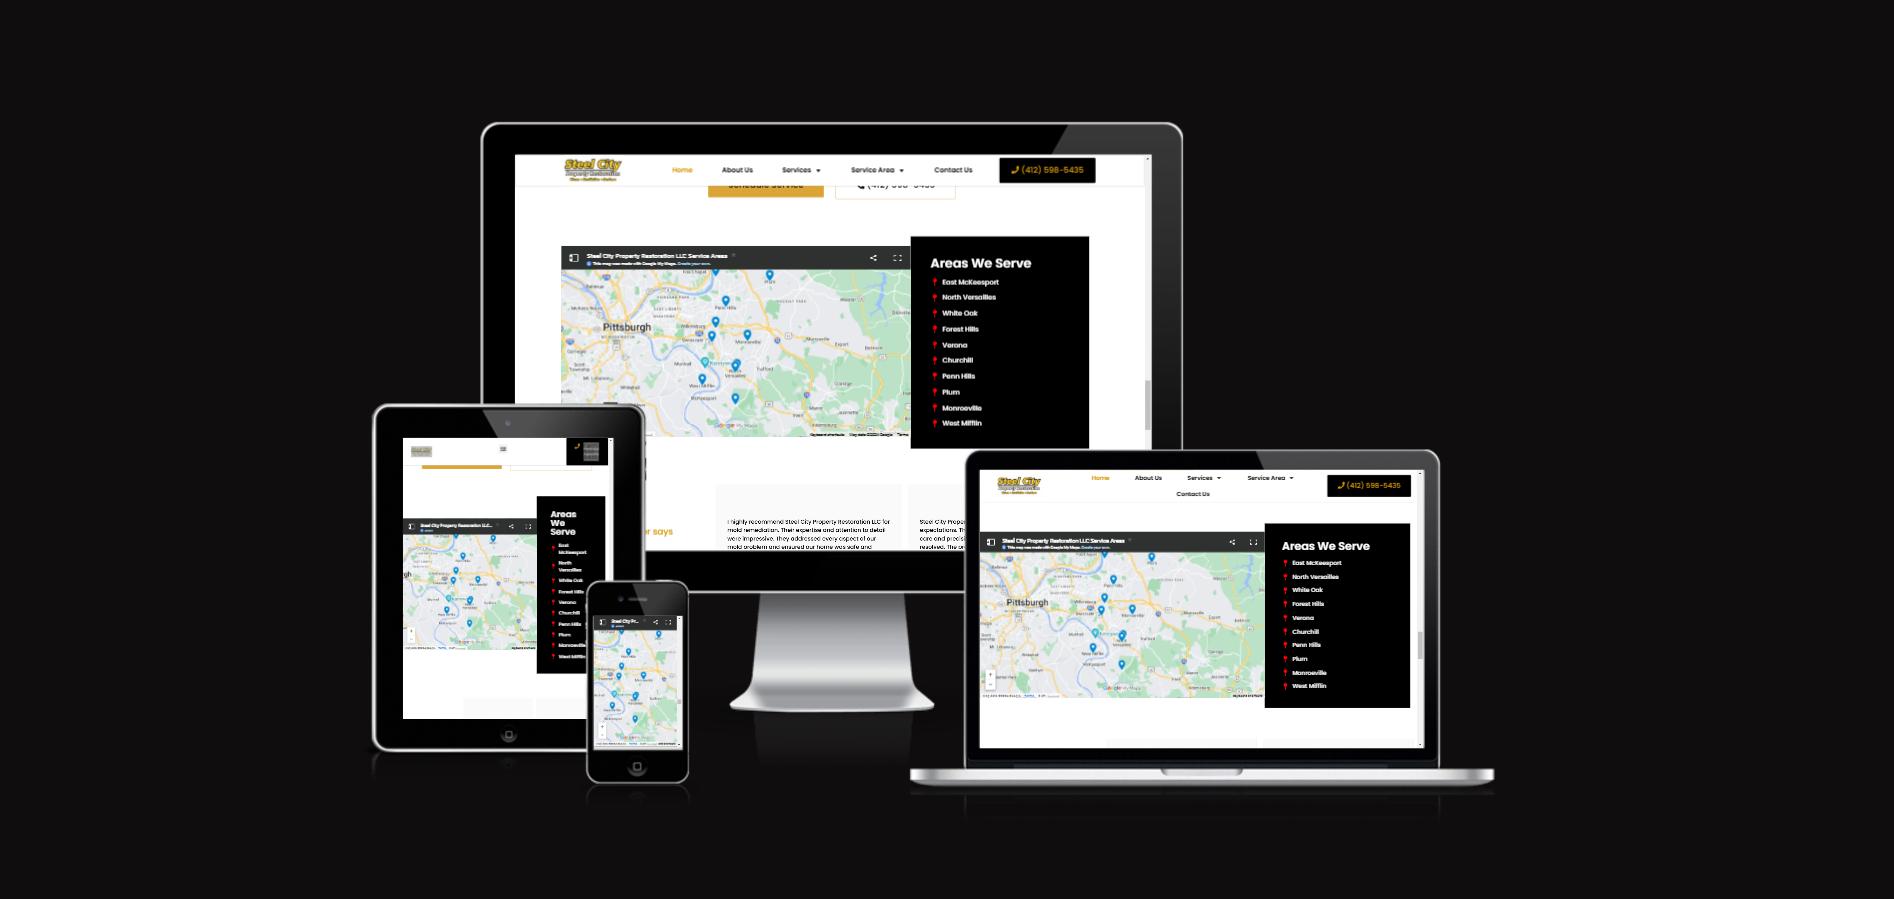
Steel City Property Restoration website features a responsive map design that automatically adjusts and scales across various screen sizes for optimal viewing on any device. (Image Source)
Google emphasizes mobile friendliness and responsive websites as a ranking factor. Beyond ranking, responsive design improves user experience by allowing maps to suit different screen sizes. Whatever tool or technology is used, ensure your map is adjustable to any device.
Helpful Tips:
- Please keep it simple and avoid unnecessary colors and features.
- Use responsive frameworks like Bootstrap, Bulma, or Tailwind CSS for flexible layouts.
- Use JavaScript libraries like Leaflet and Mapbox, which support native responsiveness.
- Test your map's responsiveness with the Responsive Test Tool, BrowserStack, or similar tools to see how your maps perform on different devices.
Simplify User Interaction Design and Options
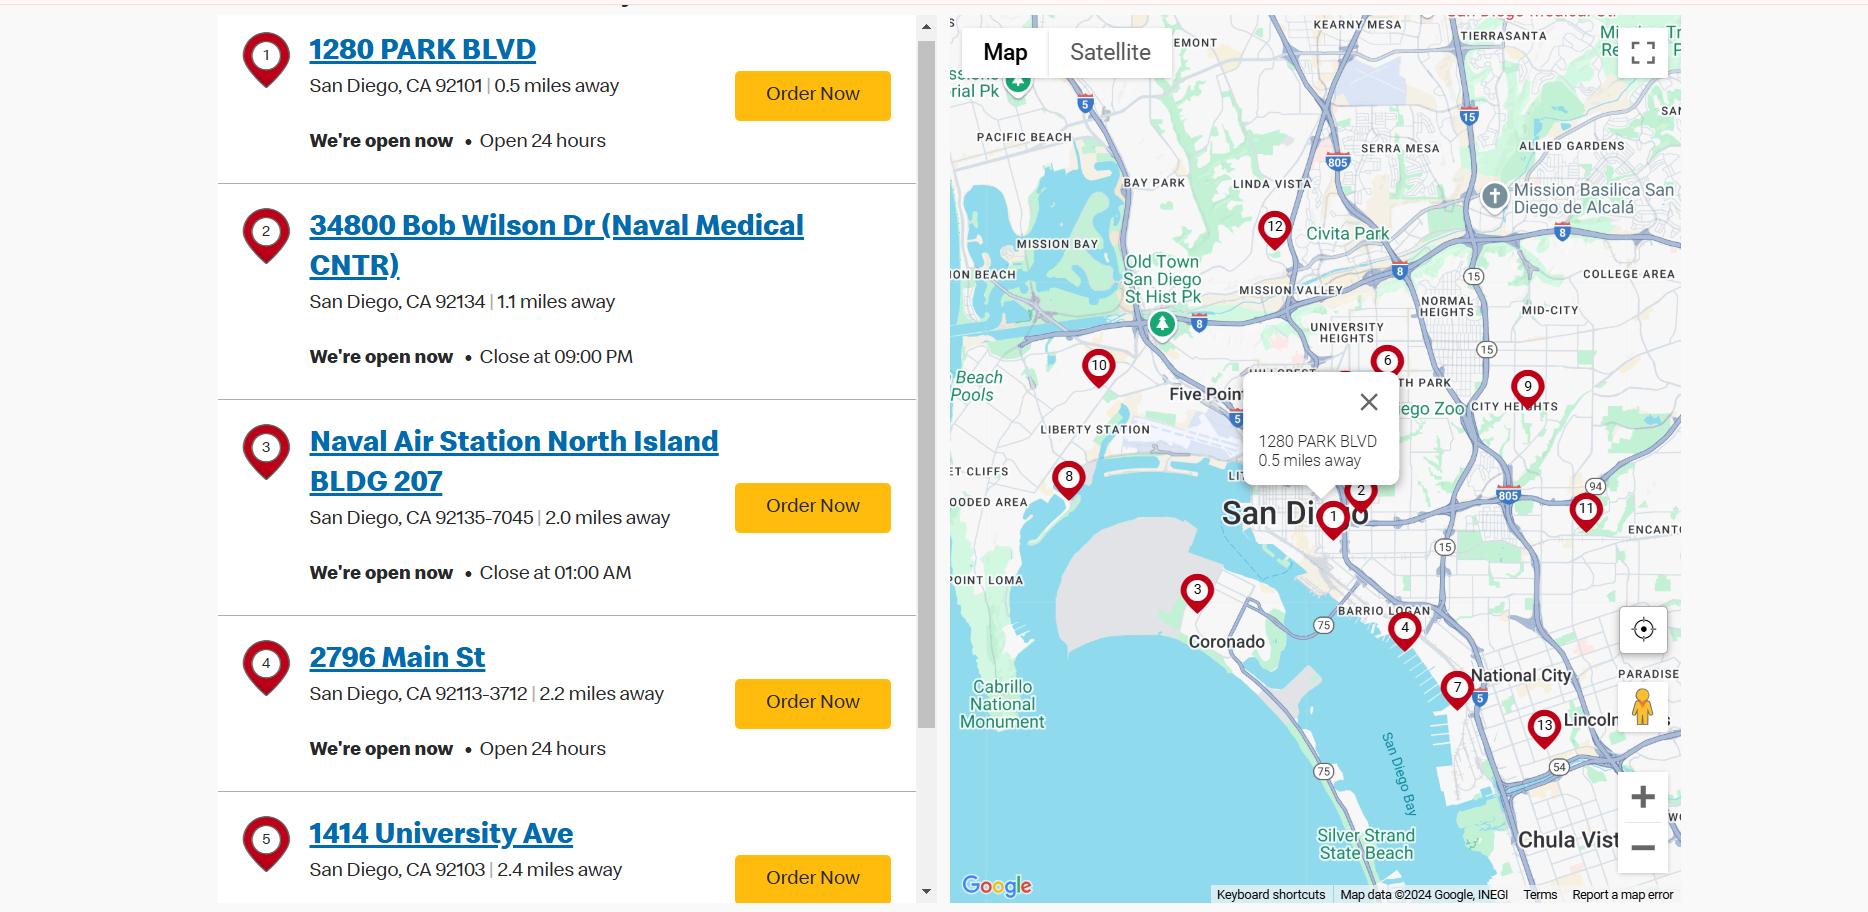
McDonald's Restaurant Locator has a straightforward map-based search feature that helps users easily find locations by Zip Code or City and state. With filter options like Mobile Deals, Drive-Thru, and McDelivery, users can quickly place orders with just a few clicks. (Image Source)
Keep your interactive map design minimalistic. Don’t overcomplicate the use of colors or mapping options. Focus on the core purpose of integrating the map into your website or application.
Helpful Tips:
- Choose simple colors, icons, and tooltips that users can easily understand.
- Include standard mapping features like zoom, panning, and map markers for a seamless experience.
- Show the most basic details and allow a wide range of filter options.
Update and Maintain Interactive Maps Resources
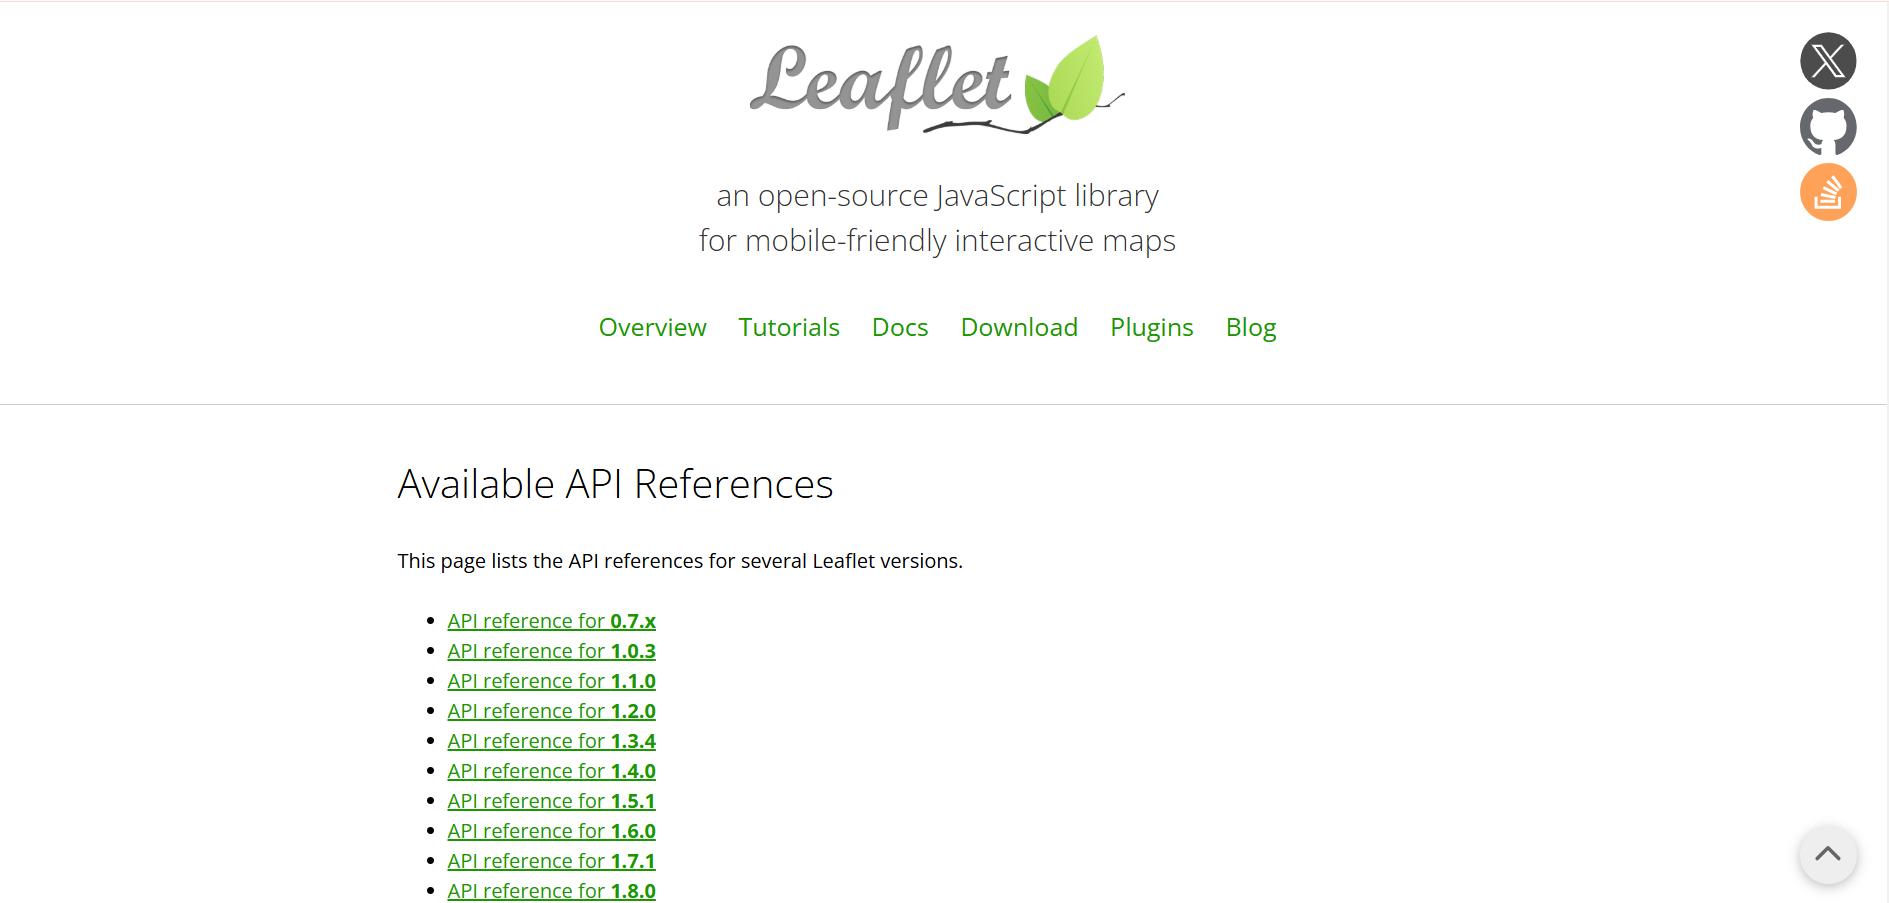
Leaflet.js provides a comprehensive list of API references for different versions of the library. This is crucial for developers to ensure they are using the latest stable version or determine if they need to upgrade. (Image Source)
Like any technology, interactive maps rely on various resources such as software, libraries, languages, and APIs to ensure accuracy and functionality. Keeping your interactive maps up to date with the latest versions of these resources or technologies is essential for providing an excellent user experience.
Helpful Tips:
- Regularly check for updates on software, libraries, and API versions, and update when necessary.
- Find and resolve code errors, missing layers, or non-functional controls promptly.
- Always consult the documentation for the tools and technologies you use to ensure your maps stay current.
- Frequently update your map's data, especially if you provide customized information.
Key Takeaways
Integrating interactive maps requires significant design considerations and relevant specialized skills. It allows you to present complex geographical data in an engaging, user-friendly way. Many website owners and marketers have benefited from these tools' immersive user experience and higher conversion rates.
Dec 17, 2024
